Pastas R US Inc Statistical Report
Hire our assignment writing services if your assignment is devastating you.
| Pastas R Us, Inc. Database (n = 74 restaurants) | |||||||||||||
| Square Feet | Per Person Average Spending | Sales Growth Over Previous Year (%) | Loyalty Card % of Net Sales | Annual Sales Per Sq Ft | Annual Sales(Total) | Median HH Income (3 Miles) | Median Age (3 Miles) | % w/ Bachelor’s Degree (3 Miles) | |||||
| Obs | SqFt | Sales/Person | SalesGrowth% | LoyaltyCard% | SalesGrowth% | Sales/SqFt | Bin Range(Sales/SqFt) | Annual Sales (T) | MedIncome | Sales/SqFt | MedAge | Sales/SqFt | BachDeg% |
| 1 | 2354 | 6.81 | -8.31 | 2.07 | -8.31 | 701.97 | 150.00 | 1,652,437.38 | 45177 | 701.97 | 34.4 | 701.97 | 31 |
| 2 | 2604 | 7.57 | -4.01 | 2.54 | -4.01 | 209.93 | 250.00 | 546,657.72 | 51888 | 209.93 | 41.2 | 209.93 | 20 |
| 3 | 2453 | 6.89 | -3.94 | 1.66 | -3.94 | 364.92 | 350.00 | 895,148.76 | 51379 | 364.92 | 40.3 | 364.92 | 24 |
| 4 | 2340 | 7.13 | -3.39 | 2.06 | -3.39 | 443.04 | 450.00 | 1,036,713.60 | 66081 | 443.04 | 35.4 | 443.04 | 29 |
| 5 | 2500 | 7.04 | -3.30 | 2.48 | -3.30 | 399.20 | 550.00 | 998,000.00 | 50999 | 399.20 | 31.5 | 399.20 | 18 |
| 6 | 2806 | 6.93 | -1.94 | 2.96 | -1.94 | 264.64 | 650.00 | 742,579.84 | 41562 | 264.64 | 36.3 | 264.64 | 30 |
| 7 | 2250 | 7.11 | -0.77 | 2.28 | -0.77 | 571.59 | 750.00 | 1,286,077.50 | 44196 | 571.59 | 35.1 | 571.59 | 14 |
| 8 | 2400 | 7.13 | -0.37 | 2.34 | -0.37 | 642.25 | 850.00 | 1,541,400.00 | 50975 | 642.25 | 37.6 | 642.25 | 33 |
| 9 | 2709 | 6.58 | -0.25 | 2.20 | -0.25 | 461.45 | 950.00 | 1,250,068.05 | 72808 | 461.45 | 34.9 | 461.45 | 28 |
| 10 | 1990 | 6.77 | -0.17 | 2.34 | -0.17 | 638.82 | 1,050.00 | 1,271,251.80 | 79070 | 638.82 | 34.8 | 638.82 | 29 |
| 11 | 2392 | 6.66 | 0.47 | 2.09 | 0.47 | 484.38 | 1,158,636.96 | 78497 | 484.38 | 36.2 | 484.38 | 39 | |
| 12 | 2408 | 7.03 | 0.55 | 2.47 | 0.55 | 581.09 | 1,399,264.72 | 41245 | 581.09 | 32.2 | 581.09 | 23 | |
| 13 | 2627 | 7.03 | 0.77 | 2.04 | 0.77 | 267.71 | 703,274.17 | 33003 | 267.71 | 30.9 | 267.71 | 22 | |
| 14 | 2500 | 7.00 | 1.92 | 2.02 | 1.92 | 572.84 | 1,432,100.00 | 90988 | 572.84 | 37.7 | 572.84 | 37 | |
| 15 | 1986 | 7.38 | 2.05 | 2.01 | 2.05 | 586.48 | 1,164,749.28 | 37950 | 586.48 | 34.3 | 586.48 | 24 | |
| 16 | 2500 | 7.18 | 2.12 | 2.64 | 2.12 | 368.73 | 921,825.00 | 45206 | 368.73 | 32.4 | 368.73 | 17 | |
| 17 | 2668 | 7.35 | 2.84 | 2.22 | 2.84 | 351.47 | 937,721.96 | 79312 | 351.47 | 32.1 | 351.47 | 37 | |
| 18 | 2517 | 6.95 | 2.88 | 2.07 | 2.88 | 458.24 | 1,153,390.08 | 37345 | 458.24 | 31.4 | 458.24 | 22 | |
| 19 | 1251 | 7.02 | 3.96 | 1.94 | 3.96 | 987.12 | 1,234,887.12 | 46226 | 987.12 | 30.4 | 987.12 | 36 | |
| 20 | 2998 | 6.85 | 4.04 | 2.17 | 4.04 | 357.45 | 1,071,635.10 | 70024 | 357.45 | 33.9 | 357.45 | 34 | |
| 21 | 2625 | 7.16 | 4.05 | 0.72 | 4.05 | 405.77 | 1,065,146.25 | 54982 | 405.77 | 35.6 | 405.77 | 26 | |
| 22 | 2300 | 6.99 | 4.05 | 2.00 | 4.05 | 680.80 | 1,565,840.00 | 54932 | 680.80 | 35.9 | 680.80 | 20 | |
| 23 | 2761 | 7.28 | 4.24 | 1.81 | 4.24 | 368.02 | 1,016,103.22 | 34097 | 368.02 | 33.6 | 368.02 | 20 | |
| 24 | 2764 | 7.07 | 4.58 | 2.13 | 4.58 | 303.95 | 840,117.80 | 46593 | 303.95 | 37.9 | 303.95 | 26 | |
| 25 | 2430 | 7.05 | 5.09 | 2.50 | 5.09 | 393.90 | 957,177.00 | 51893 | 393.90 | 40.6 | 393.90 | 21 | |
| 26 | 2154 | 6.54 | 5.14 | 2.63 | 5.14 | 562.12 | 1,210,806.48 | 88162 | 562.12 | 37.7 | 562.12 | 37 | |
| 27 | 2400 | 6.70 | 5.48 | 1.95 | 5.48 | 494.88 | 1,187,712.00 | 89016 | 494.88 | 36.4 | 494.88 | 34 | |
| 28 | 2430 | 6.91 | 5.86 | 2.04 | 5.86 | 310.07 | 753,470.10 | 114353 | 310.07 | 40.9 | 310.07 | 34 | |
| 29 | 2549 | 7.58 | 5.91 | 1.41 | 5.91 | 373.46 | 951,949.54 | 75366 | 373.46 | 35.0 | 373.46 | 30 | |
| 30 | 2500 | 7.03 | 5.98 | 2.05 | 5.98 | 235.81 | 589,525.00 | 48163 | 235.81 | 26.4 | 235.81 | 16 | |
| 31 | 3653 | 6.84 | 6.08 | 2.13 | 6.08 | 413.08 | 1,508,981.24 | 49956 | 413.08 | 37.1 | 413.08 | 28 | |
| 32 | 2440 | 6.94 | 6.08 | 2.08 | 6.08 | 625.22 | 1,525,536.80 | 45990 | 625.22 | 30.3 | 625.22 | 36 | |
| 33 | 2600 | 7.07 | 6.13 | 2.73 | 6.13 | 274.30 | 713,180.00 | 45723 | 274.30 | 31.3 | 274.30 | 18 | |
| 34 | 2160 | 7.00 | 6.27 | 1.95 | 6.27 | 542.62 | 1,172,059.20 | 43800 | 542.62 | 29.6 | 542.62 | 36 | |
| 35 | 2800 | 7.08 | 6.57 | 2.04 | 6.57 | 178.56 | 499,968.00 | 68711 | 178.56 | 32.9 | 178.56 | 18 | |
| 36 | 2757 | 6.75 | 6.90 | 1.62 | 6.90 | 375.33 | 1,034,784.81 | 65150 | 375.33 | 40.7 | 375.33 | 24 | |
| 37 | 2450 | 6.81 | 6.94 | 1.95 | 6.94 | 329.09 | 806,270.50 | 39329 | 329.09 | 29.3 | 329.09 | 22 | |
| 38 | 2400 | 7.64 | 7.12 | 1.64 | 7.12 | 297.37 | 713,688.00 | 63657 | 297.37 | 37.3 | 297.37 | 29 | |
| 39 | 2270 | 6.62 | 7.39 | 1.78 | 7.39 | 323.17 | 733,595.90 | 67099 | 323.17 | 39.8 | 323.17 | 25 | |
| 40 | 2800 | 6.76 | 7.67 | 2.23 | 7.67 | 468.84 | 1,312,752.00 | 75151 | 468.84 | 33.9 | 468.84 | 28 | |
| 41 | 2520 | 7.11 | 7.91 | 2.15 | 7.91 | 352.57 | 888,476.40 | 93876 | 352.57 | 35.0 | 352.57 | 40 | |
| 42 | 2487 | 7.05 | 8.08 | 2.83 | 8.08 | 380.34 | 945,905.58 | 79701 | 380.34 | 35.0 | 380.34 | 39 | |
| 43 | 2629 | 6.90 | 8.27 | 2.37 | 8.27 | 398.12 | 1,046,657.48 | 77115 | 398.12 | 35.9 | 398.12 | 30 | |
| 44 | 3200 | 7.17 | 8.54 | 3.07 | 8.54 | 312.15 | 998,880.00 | 52766 | 312.15 | 33.0 | 312.15 | 17 | |
| 45 | 2335 | 6.75 | 8.58 | 2.19 | 8.58 | 452.16 | 1,055,793.60 | 32929 | 452.16 | 30.9 | 452.16 | 22 | |
| 46 | 2500 | 7.45 | 8.72 | 1.28 | 8.72 | 698.64 | 1,746,600.00 | 87863 | 698.64 | 38.5 | 698.64 | 29 | |
| 47 | 2449 | 7.00 | 8.75 | 1.76 | 8.75 | 367.19 | 899,248.31 | 73752 | 367.19 | 40.5 | 367.19 | 19 | |
| 48 | 2625 | 6.96 | 8.79 | 2.51 | 8.79 | 431.93 | 1,133,816.25 | 85366 | 431.93 | 32.1 | 431.93 | 29 | |
| 49 | 3150 | 7.30 | 8.90 | 1.90 | 8.90 | 367.06 | 1,156,239.00 | 39180 | 367.06 | 34.8 | 367.06 | 18 | |
| 50 | 2625 | 6.96 | 9.12 | 1.98 | 9.12 | 400.53 | 1,051,391.25 | 56077 | 400.53 | 38.0 | 400.53 | 19 | |
| 51 | 2741 | 6.71 | 9.47 | 2.41 | 9.47 | 414.36 | 1,135,760.76 | 77449 | 414.36 | 37.0 | 414.36 | 34 | |
| 52 | 2500 | 6.82 | 10.17 | 2.17 | 10.17 | 481.11 | 1,202,775.00 | 56822 | 481.11 | 34.7 | 481.11 | 25 | |
| 53 | 2450 | 6.58 | 10.66 | 2.16 | 10.66 | 538.06 | 1,318,247.00 | 80470 | 538.06 | 36.4 | 538.06 | 30 | |
| 54 | 2986 | 7.56 | 10.97 | 0.29 | 10.97 | 330.48 | 986,813.28 | 55584 | 330.48 | 36.8 | 330.48 | 21 | |
| 55 | 2967 | 6.98 | 11.34 | 1.85 | 11.34 | 249.93 | 741,542.31 | 78001 | 249.93 | 32.2 | 249.93 | 30 | |
| 56 | 3000 | 7.28 | 11.45 | 1.88 | 11.45 | 291.87 | 875,610.00 | 75307 | 291.87 | 34.8 | 291.87 | 30 | |
| 57 | 2500 | 6.76 | 11.51 | 2.19 | 11.51 | 517.40 | 1,293,500.00 | 76375 | 517.40 | 36.7 | 517.40 | 28 | |
| 58 | 2600 | 6.92 | 11.73 | 2.56 | 11.73 | 551.58 | 1,434,108.00 | 61857 | 551.58 | 33.8 | 551.58 | 31 | |
| 59 | 2800 | 6.73 | 11.83 | 2.16 | 11.83 | 386.81 | 1,083,068.00 | 61312 | 386.81 | 34.2 | 386.81 | 16 | |
| 60 | 2986 | 6.91 | 11.95 | 2.10 | 11.95 | 427.50 | 1,276,515.00 | 72040 | 427.50 | 39.0 | 427.50 | 31 | |
| 61 | 2223 | 6.77 | 12.47 | 1.98 | 12.47 | 453.94 | 1,009,108.62 | 92414 | 453.94 | 34.9 | 453.94 | 40 | |
| 62 | 2300 | 7.33 | 12.80 | 0.87 | 12.80 | 512.46 | 1,178,658.00 | 92602 | 512.46 | 39.3 | 512.46 | 33 | |
| 63 | 3799 | 7.87 | 13.78 | 1.07 | 13.78 | 345.27 | 1,311,680.73 | 59599 | 345.27 | 35.6 | 345.27 | 28 | |
| 64 | 2700 | 6.95 | 14.09 | 3.38 | 14.09 | 234.04 | 631,908.00 | 72453 | 234.04 | 36.0 | 234.04 | 23 | |
| 65 | 2650 | 7.33 | 14.23 | 1.17 | 14.23 | 348.33 | 923,074.50 | 67925 | 348.33 | 41.1 | 348.33 | 16 | |
| 66 | 2500 | 6.95 | 14.60 | 2.14 | 14.60 | 348.47 | 871,175.00 | 42631 | 348.47 | 24.7 | 348.47 | 25 | |
| 67 | 2994 | 7.21 | 14.88 | 0.93 | 14.88 | 294.95 | 883,080.30 | 75652 | 294.95 | 40.5 | 294.95 | 25 | |
| 68 | 2718 | 7.25 | 15.42 | 2.22 | 15.42 | 361.14 | 981,578.52 | 39650 | 361.14 | 32.9 | 361.14 | 18 | |
| 69 | 3700 | 7.65 | 16.18 | 1.68 | 16.18 | 467.71 | 1,730,527.00 | 48033 | 467.71 | 30.3 | 467.71 | 15 | |
| 70 | 2000 | 6.93 | 17.23 | 2.41 | 17.23 | 403.78 | 807,560.00 | 67403 | 403.78 | 36.2 | 403.78 | 19 | |
| 71 | 2400 | 6.79 | 18.43 | 2.81 | 18.43 | 245.74 | 589,776.00 | 80597 | 245.74 | 32.4 | 245.74 | 27 | |
| 72 | 2450 | 7.37 | 20.76 | 1.09 | 20.76 | 339.94 | 832,853.00 | 60928 | 339.94 | 43.5 | 339.94 | 21 | |
| 73 | 2575 | 6.76 | 25.54 | 0.64 | 25.54 | 400.82 | 1,032,111.50 | 73762 | 400.82 | 41.6 | 400.82 | 29 | |
| 74 | 2400 | 7.97 | 28.81 | 1.77 | 28.81 | 326.54 | 783,696.00 | 64225 | 326.54 | 31.4 | 326.54 | 15 | |
| Median | 2500 | 7 | 7.03 | 2.075 | 396.01 | 1035749.205 | 62757 | 35 | 26.5 | ||||
| Max | 3799 | 7.97 | 28.81 | 3.38 | 987.12 | 1746600 | 114353 | 43.5 | 40 | ||||
| Min | 1251 | 6.54 | -8.31 | 0.29 | 178.56 | 499968 | 32929 | 24.7 | 14 | ||||
| Q1 | 2400 | 6.825 | 3.98 | 1.8575 | 332.845 | 877477.575 | 46953 | 32.525 | 20.25 | ||||
| Q3 | 2735.25 | 7.1775 | 11.4225 | 2.325 | 483.5625 | 1228866.96 | 76194.25 | 37.525 | 30.75 | ||||
| Q1-Min | 1149 | 0.285 | 12.29 | 1.5675 | 154.285 | 377509.575 | 14024 | 7.825 | 6.25 | ||||
| Median-Q1 | 100 | 0.175 | 3.05 | 0.2175 | 63.165 | 158271.63 | 15804 | 2.475 | 6.25 | ||||
| Q3-Median | 235.25 | 0.1775 | 4.3925 | 0.25 | 87.5525 | 193117.755 | 13437.25 | 2.525 | 4.25 | ||||
| Max-Q3 | 1063.75 | 0.7925 | 17.3875 | 1.055 | 503.5575 | 517733.04 | 38158.75 | 5.975 | 9.25 | ||||
Introduction
Pastas R US Inc. Company intends to use data from its 74 chain restaurants to make critical decisions regarding business expansion. This analysis is crucial for the company’s operations since it incorporates the most important aspects, which include average sales per customer, sales per square feet, year-to-year percentage sales growth, loyalty card use as a percentage of sales, and customer demographics such as the median age and income. Particularly, the current analysis of the above-mentioned variables will be useful to inform the company whether opening new restaurants within a 3-mile radius is a profitable venture as well as the effectiveness of the newly introduced measures such as the Loyalty Card. The report also presents recommendations from the findings.
Section 1: Scope and Descriptive Statistics
State the report’s objective.
The main object of the current report is to analyze operational variables at Pastas R US Inc., such as sales per customer, sales per square feet, year-to-year percentage sales growth, loyalty card use as a percentage of sales, and customer demographics such as the median age and income to recommend a framework of workable and realistic opportunities for improvement depending on the prevailing circumstances. The company intends to open new restaurants within a 3-mile radius, and the current management wants to identify ways of improving the current expansion criteria. They want to analyze the current strategies to discover opportunities for the upcoming expansion project.
Discuss the nature of the current database. What variables were analyzed?
The database used contains data for 74 chain restaurants in different regions. The database contained age brackets between 25 and 45 years and the household median income considered was to be above the national average. Regarding education levels, the adult population comprises at least 15% of college-educated individuals. The variables considered for the analysis were critical for the company’s operations, which included average sales per customer, sales per square feet, year-to-year percentage sales growth, loyalty card use as a percentage of sales, and customer demographics such as the median age and income. These variables were analyzed descriptively to come up with simple descriptive statistics.
Summary of Descriptive Statistics
|
|
SalesGrowth% | LoyaltyCard% | Sales/SqFt | MedIncome | Sales/SqFt | MedAge | BachDeg% |
| Mean | 7.414054054 | 2.026486486 | 420.305405 | 62807.7027 | 420.305405 | 35.2014 | 26.3108108 |
| Standard Error | 0.770109257 | 0.064211803 | 15.9537705 | 2081.32945 | 15.9537705 | 0.42483 | 0.8142851 |
| Median | 7.03 | 2.075 | 396.01 | 62757 | 396.01 | 35 | 26.5 |
| Mode | 4.05 | 2.04 | #N/A | #N/A | #N/A | 34.8 | 29 |
| Standard Deviation | 6.624730322 | 0.552370812 | 137.239523 | 17904.273 | 137.239523 | 3.65455 | 7.00474531 |
| Sample Variance | 43.88705183 | 0.305113514 | 18834.6868 | 320562990 | 18834.6868 | 13.3558 | 49.0664569 |
| Kurtosis | 1.146166018 | 1.4536002 | 2.88051314 | -0.511606 | 2.88051314 | 0.16388 | -0.9372979 |
| Skewness | 0.493747471 | -0.756891114 | 1.23589655 | 0.29783801 | 1.23589655 | -0.167 | 0.1405442 |
| Range | 37.12 | 3.09 | 808.56 | 81424 | 808.56 | 18.8 | 26 |
| Minimum | -8.31 | 0.29 | 178.56 | 32929 | 178.56 | 24.7 | 14 |
| Maximum | 28.81 | 3.38 | 987.12 | 114353 | 987.12 | 43.5 | 40 |
| Sum | 548.64 | 149.96 | 31102.6 | 4647770 | 31102.6 | 2604.9 | 1947 |
| Count | 74 | 74 | 74 | 74 | 74 | 74 | 74 |
| Confidence Level(95.0%) | 1.534825536 | 0.127973938 | 31.7958188 | 4148.08362 | 31.7958188 | 0.84669 | 1.62286787 |
Summarize your descriptive statistics findings from Excel. Use a table and insert appropriate graphs. Refer to Week One Assignment for descriptive statistics.
LoyaltyCard(%) versus SalesGrowth(%)
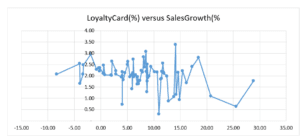
LoyaltyCard(%) versus SalesGrowth(%)
MedAge versus BachDeg%
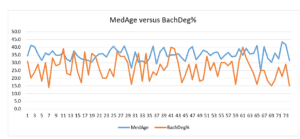
MedAge versus BachDeg%
Section 3: Recommendations and Implementation
Summarize your descriptive statistics findings from Excel. Use a table and insert appropriate graphs. Refer to Week One Assignment for descriptive statistics.
Based on the above findings, only education levels seem to be positively related to sales per square foot. This implies that the higher the education level, the higher the sales per square foot. It means that expansion criteria based on education levels could be effective for the company. For instance, targeting areas with intellectuals may increase sales.
Based on your findings above, does it appear as if the Loyalty Card is positively correlated with sales growth? Would you recommend changing this marketing strategy?
From the analysis, loyalty cards are negatively correlated with sales growth. Since the company’s target was sales growth through the loyalty card, it is recommended to change the strategy and adopt an alternative approach to boost sales.
Based on your previous findings, recommend marketing positioning that targets a specific demographic. (Hint: Are younger people patronizing the restaurants more than older people?)
Market positioning is a crucial strategy in product marketing. The advantage of market targeting is that the company will study a specific consumer group, which enables the company to establish the most appropriate pricing, product promotion, and distribution strategies (Ward, 2020). For instance, the above analysis implies that the company can target regions with young educated millennials to increase its sales. The negative correlation between median age and sales per square implies that an increase in customers’ age will lead to low sales. Therefore, the company needs to target younger people.
Indicate what information should be collected to track and evaluate the effectiveness of your recommendations. How can this data be collected? (Hint: Would you use survey/samples or census?)
Market research and information gathering are vital for the formulation of the most appropriate market strategies. The consumption habits for the target customer segments are one of the information that can be obtained to evaluate the effectiveness of the above recommendations. For instance, the company can adopt a customer survey to understand consumer habits vis-à-vis the company’s products. The survey can be conducted through an online platform and in its various chain store outlets. Customer feedback will guide the company on the best strategies to adopt.
Therefore, in order to make sound decisions regarding a business, an analysis of specific situations and variables is crucial. The management has taken a vital step before making the expansion decisions. From the above recommendations, the company can figure out the course of action.
References
Field A. (2018). Discovering Statistics Using IBM SPSS Statistics, Sage Publishers, California.
Ward, S. (2020). “Target Marketing and Market Segmentation.” https://www.thebalancesmb.com/target-marketing-2948355
ORDER A PLAGIARISM-FREE PAPER HERE
We’ll write everything from scratch
Question 
DAT 451 MVSU Pastas R US Inc Statistical Report
Assignment Content
Resources:
Pastas R US Inc Statistical Report
- Pastas R Us, Inc. Database & Microsoft Excel®,
- Wk 1: Descriptive Statistics Analysis Assignment
Purpose
This assignment is intended to help you learn how to apply statistical methods when analyzing operational data, evaluating the performance of current marketing strategies, and recommending actionable business decisions. This is an opportunity to build critical-thinking and problem-solving skills within the context of data analysis and interpretation. You’ll gain a first-hand understanding of how data analytics supports decision-making and adds value to an organization.
Scenario:
Pastas R Us, Inc. is a fast-casual restaurant chain specializing in noodle-based dishes, soups, and salads. Since its inception, the business development team has favored opening new restaurants in areas (within a 3-mile radius) that satisfy the following demographic conditions:
- Median age between 25 – 45 years old
- Household median income above national average
- At least 15% college educated adult population
Last year, the marketing department rolled out a Loyalty Card strategy to increase sales. Under this program, customers present their Loyalty Card when paying for their orders and receive some free food after making 10 purchases.
The company has collected data from its 74 restaurants to track important variables such as average sales per customer, year-on-year sales growth, sales per sq. ft., Loyalty Card usage as a percentage of sales, and others. A key metric of financial performance in the restaurant industry is annual sales per sq. ft. For example, if a 1200 sq. ft. restaurant recorded $2 million in sales last year, then it sold $1,667 per sq. ft.
Executive management wants to know whether the current expansion criteria can be improved. They want to evaluate the effectiveness of the Loyalty Card marketing strategy and identify feasible, actionable opportunities for improvement. As a member of the analytics department, you’ve been assigned the responsibility of conducting a thorough statistical analysis of the company’s available database to answer executive management’s questions.
Report:
Write a 750- to 900-word statistical paper that includes the following sections:
- Introduction – Should include thesis statement that introduces the paper to the reader
- Section 1: Scope and descriptive statistics
- Section 2: Analysis
- Section 3: Recommendations and Implementation
- Conclusion – Should summarize the paper and let the reader know that the paper is ending. Do not begin the conclusion paragraph with “In Conclusion.”
Section 1 – Scope and descriptive statistics
- State the report’s objective.
- Discuss the nature of the current database. What variables were analyzed?
- Summarize your descriptive statistics findings from Excel. Use a table and insert appropriate graphs. Refer to Week One Assignment for descriptive statistics.
Section 2 – Analysis
- Using Excel, create scatter plots and display the regression equations for the following pairs of variables:
- “BachDeg%” versus “Sales/SqFt”
- “MedIncome” versus “Sales/SqFt”
- “MedAge” versus “Sales/SqFt”
- “LoyaltyCard(%)” versus “SalesGrowth(%)”
- In your report, include the scatter plots as an Appendix to the paper that follows the Reference page.
- Refer to each scatter plot and designate the type of relationship observed (increasing/positive, decreasing/negative, or no relationship) and determine what you can conclude from these relationships.
Section 3: Recommendations and implementation
- Based on your findings above, assess which expansion criteria seem to be more effective.Could any expansion criterion be changed or eliminated? If so, which one and why?
- Based on your findings above, does it appear as if the Loyalty Card is positively correlated with sales growth? Would you recommend changing this marketing strategy?
- Based on your previous findings, recommend marketing positioning that targets a specific demographic. (Hint: Are younger people patronizing the restaurants more than older people?)
- Indicate what information should be collected to track and evaluate the effectiveness of your recommendations. How can this data be collected? (Hint: Would you use survey/samples or census?)
Use the Excel spreadsheet to show your work.
Format your assignment consistent with APA format with at least one (1) scholarly, peer-reviewed reference and one reference from the assigned readings (textbook). Points will be deducted for not including either of them.
Please Include:
- An Introduction paragraph (Do Not Write the word Introduction to begin the body of the paper – Use the title of the paper instead). There should be a thesis statement in the introduction paragraph.
- At least three (3) Level One Headings
- Conclusion Heading.
Submit the Excel Spreadsheet and the Paper. You must submit the spreadsheet to show your work.