Quality Control
Problem 2
Control limits are horizontal lines placed above (UCL) and below (LCL) the center line; they determine if a process is out of control.
First, compute the mean () of the provided samples to determine the control limits and apply the UCL and LCL formulas.
x ̅=(∑_(i=1)^n▒x_i )/n
σ=√((∑_(i=1)^n▒〖(x_i-x ̅)〗^2 )/(n-1))
UCL=x ̿+zσ_x ̅
LCL=x ̿-zσ_x ̅
σ_x ̅ =σ/√n
Finding the mean for each sample.
| Samples of shampoo bottle volume in Ounces | |||||
| Observations | |||||
| Sample | 1 | 2 | 3 | 4 | Mean |
| 1 | 19.7 | 20.6 | 18.9 | 20.8 | 20 |
| 2 | 19.7 | 20.2 | 18.9 | 20.7 | 19.875 |
| 3 | 19.7 | 18.7 | 21.6 | 20 | 20 |
| Total | 59.875 | ||||
Finding the center line, which is the average of the samples.
x ̿=59.875/3=19.958
Finding the upper and lower control limits.
UCL=x ̿+zσ_x ̅ =19.958+3(0.2/√4)=20.258
The upper control limit is 20.258
UCL=x ̿+zσ_x ̅ =19.96-3(0.2/√4)=19.658
The lower control limit is 19.658.
The center line is always between the UCL and the LCL and is equal to 19.958
Are you facing any trouble with your “Quality Control assignment”? Contact us.
Problem 4
X-bar/mean charts are used to evaluate deviations in a particular process. Theyassesse the dispersion of functions results; the mean is considered the central tendency, and the upper and lower control limits are considered the extreme distribution limits.
The UCL and LCL are calculated using the formulas below:
UCL=x ̿+A_2 R ̅
LCL=x ̿-A_2 R ̅
R-charts identify the variability in a process by evaluating the process ranges.
The UCL and LCL are calculated as follows:
UCL=D_4 R ̅
LCL=D_3 R ̅
Where:
x ̿=mean of sample
R ̅=mean of sample range
A_2=x bar charts sigma control limit
D_n=R charts sigma control limits
| Observations | ||||||
| Sample | 1 | 2 | 3 | 4 | Average | Range |
| 1 | 16.4 | 16.11 | 15.9 | 15.78 | 16.0475 | 0.62 |
| 2 | 15.97 | 16.1 | 16.2 | 15.81 | 16.02 | 0.39 |
| 3 | 15.91 | 16 | 16.04 | 15.92 | 15.9675 | 0.13 |
| 4 | 16.2 | 16.21 | 15.93 | 15.95 | 16.0725 | 0.28 |
| 5 | 15.87 | 16.21 | 16.34 | 16.43 | 16.2125 | 0.56 |
| 6 | 15.43 | 15.49 | 15.55 | 15.92 | 15.5975 | 0.49 |
| 7 | 16.43 | 16.21 | 15.99 | 16 | 16.1575 | 0.44 |
| 8 | 15.5 | 15.92 | 16.12 | 16.02 | 15.89 | 0.62 |
| 9 | 16.13 | 16.21 | 16.05 | 16.01 | 16.1 | 0.2 |
| 10 | 15.68 | 16.43 | 16.2 | 15.97 | 16.07 | 0.75 |
| Total | 160.135 | 4.48 | ||||
Range = Maximum Observation – Minimum Observation
Finding the center line for both x-bar charts and R-charts.
x ̿=160.135/10=16.01
R ̅=(Total Range)/(Number of Samples)=4.48/10=4.45
Calculating the UCL and LCL for x-bar charts:
UCL=16.01+0.73(4.48/10)=16.34
LCL=16.01-0.73(4.48/10)=15.68
The bar chart is shown below.
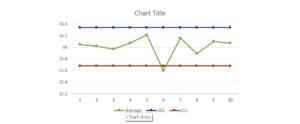
X Bar Chart
The 6th sample is outside the control limit meaning the process is out of control.
Finding UCL and LCL for R-chart.
UCL=0.28×0.45=1.03
lCL=0×0.45=0
Plotting the R-chart.
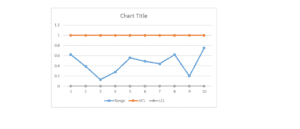
R Chart
Since the samples are within the control limits, the variability of the process is within control.
To determine if the process is capable of meeting the design standards, calculate the Measure.
C_pk=min((USL-mean)/3σ,(mean-LSL)/3σ)
C_pk=min((16.34-16.01)/3(0.45/√4) ,(16.01-15.68)/3(0.45/√4) )
=min(0.49,0.49)
Since C_pk Is less than 1, the process cannot meet the design standard.
Other Related Post: Financial Disclosure
References
Reid, R. D., & Sanders, N. R. (2016). Operations Management, Binder Ready Version: An Integrated Approach. John Wiley & Sons.
ORDER A PLAGIARISM-FREE PAPER HERE
We’ll write everything from scratch
Question 
[u04a1] Unit 4 Assignment 1 Quality Control
Complete problems 2 and 4 on pages 227–228 of your textbook. For help completing these problems, see the Solved Problems on pages 222–227.
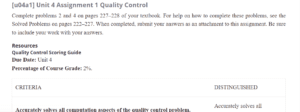
Quality Control
When completed, submit your answers as an attachment to this assignment. Be sure to include your work with your answers.
Resources
Quality Control Scoring Guide
Due Date: Unit 4
Percentage of Course Grade: 2%.
| CRITERIA | DISTINGUISHED |
| Accurately solves all computation aspects of the quality control problem. 50% |
Accurately solves all computation aspects of the problem and shows work. |
| Provides summary and rationale helpful in interpreting the quality control results. 50% |
Accurately summarizes salient points with supporting rationale for interpreting results. |