Board Brief – Data Analysis
Data Sources and Reliability
The process of collecting data for the opportunity relied on secondary data. Secondary data was obtained from different sources, including journals and online publications. The data that was collected highlighted the use of BNPL, the trade’s global market share, the variety of providers that offer the financial service, the demographics of clients using the service, and the variance in conversion rates after using the financial service.
The sources used for data collection include Statista.com, which contains varied data regarding the BNPL financial service. The website IBS Intelligence also provided information about the market player, Fiserv (Pavithra, 2020). The Payments Journal provided information regarding the BNPL product. The article on the Payments Journal highlights information about the automation process that banks are already adopting, the reasons that could lead to the slow growth of the BNPL, and its current performance. The Payments Journal resource is based on the need for banks to embrace the new aspect of financial products (PaymentsJournal, 2022). The Afterpay website also provided critical information about the BNPL model and how it works.
The validity and reliability of the data that was used to address the opportunity were determined using different aspects. First, the data that was provided on Statista was compared to other sources of information, such as affiliate links that are provided alongside the description. Secondly, choosing websites such as Statista was strategic because the site holds a solid reputation in relation to the provision of different types of statistics. All the sources provided the affiliate links that provided more information that could be used to verify the statements and conclusions in the specific resource. The use of websites that are associated with the BNPL model increases the validity of the information because it comes from the company itself.
The data that is unknown now is the approach that the BNPL service providers would take if the customers failed to honor their installments. This would lead to a high default rate that could affect the merchants and BNPL facilitators differently. The lack of such data interferes with the completeness of analysis because one is incapable of providing complete information regarding the risks associated with the BNPL financial service.
Data Tools and Analysis
The descriptive analysis was used to complete this coursework element. The descriptive analysis assumes a qualitative approach, which involves reliance on secondary sources’ information to make a conclusion regarding the identified patterns. This approach was chosen because it not only pays attention to the figures, but also the clients’ feelings about the financial product. The non-numeric data regarding the product highlights the elements that add greater value to the analysis.
The most significant trend that is established in the analysis highlights the increasing acceptance of the BNPL financial service. The product’s ability to change the current conversion rates for online merchants because they can easily and conveniently acquire items. This has reduced the cart abandonment rate significantly. In addition, the product is congruent with the decreased use of credit cards. Few people are using credit cards, which are offered by banks, which creates a gap for BNPL products. Its spread in different countries, including Japan, Australia, and the USA, shows the potential that the product has. In addition, companies such as PayPal Holdings acquired Paidy, a Japanese company that offers BNPL services, in 2021 (Park, 2021). This confirms that financial services are increasingly gaining acceptance and significance in the market.
Graph 1: BNPL Market Share by Country
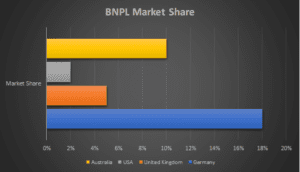
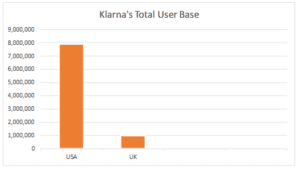
Based on graph 1 above, BNPL is highly accepted in Germany and Australia and least accepted in the USA. Different companies offer these BNPL products in different countries. Other countries that offer the BNPL services include New Zealand, Japan, and Sweden. These companies include PayPal, Klarna, Affirm, Afterpay, and Quad Pay. Graph 2 below shows that Klarna occupies the largest share in the USA. Most of the users are aged 18 to 24 years, millennials, or within Generation Z (de Best, 2021).
Graph 2: Klarna’s Total User Base
Conclusion and action items
This analysis highlights a need for more financial sector players to offer BNPL services. The convenience that the service offers is beneficial to clients who are willing to purchase but lack sufficient funds. The acceptance among merchants is fueled by the increased rate of conversion on their websites. Fewer clients abandon their carts while shopping. This means that online merchants have increased revenues. The accessibility of the clients’ credit rating is also important in determining legible and less eligible clients. This is a proactive measure that could ensure the default rates are not excessively risky. The financial service tends to benefit clients more than credit cards do, and as more individual subscribers opt for the BNPL services, the traditional modes of accessing similar services will be disrupted. However, more attention should be paid to the issues related to defaulting of payments. Addressing these issues will reduce the risk of the service and probably encourage more merchants to provide the same to their clients as well as adoption in banks.
References
de Best, R. (2021). Buy Now, Pay Later (BNPL) – statistics & facts. Retrieved from Statista: https://www.statista.com/topics/8107/buy-now-pay-later-bnpl/#dossierKeyfigures
Park, K. (2021). PayPal acquires Japan’s Paidy for $2.7B to crack the buy now, pay later market in Asia.
Pavithra, R. (2020). Fiserv introduces “Buy Now, Pay Later” installment payment option. Retrieved from IBS Intelligence: https://ibsintelligence.com/ibsi-news/fiserv-introduces-buy-now-pay-later-installment-payment-option/
PaymentsJournal. (2022). The Juggernaut Continues: Why Banks Should Make Moves into BNPL. PaymentsJournal. Retrieved from https://www.paymentsjournal.com/the-juggernaut-continues-why-banks-should-make-moves-into-bnpl/
ORDER A PLAGIARISM-FREE PAPER HERE
We’ll write everything from scratch
Question 
Board Brief – Data Analysis
Overview
The second part of your Board Brief picks up where the last one left off. Having accurately framed the core problem/opportunity in Assignment 1, you will now turn your attention to collecting, organizing, and analyzing the data you are using to test your hypothesis. You are not yet ready to propose a specific action plan for your business. You will focus on evaluating what data you have and don’t have and on identifying patterns, trends, and anomalies. Because you can never have complete data, your analysis must acknowledge what you know and what you don’t know. But, even with incomplete data, your actions must be reasonable, given the time frame and resources you have. Those actions – your strategic plan – will be developed in Assignment 3.
Instructions
For this assignment, you will build on your first assignment by including an additional 3 to 4 pages to present your analysis of the data. Your submission must include the work you did in Assignment 1 and must provide relevant and quantifiable data, models, calculations, and analysis. Use the topics below to organize this section of your Board Brief:
1. Data Sources and Reliability
- What data were the most critical to the analysis of the problem/opportunity you identified in Assignment 1?
- What sources did you use to gather the data?
- How reliable and complete are the data you are using? What steps did you take to validate this?
- What data are unknown (or unknowable) at this stage? How does this impact your analysis?
2. Data Tools and Analysis
- Drawing from the “Types of Analysis” guide and other resources from the course, what tools and techniques have you used in your analysis? Why did you select these?
- Applying the analysis tools to your selected data, what patterns, trends, and anomalies did you uncover?
- How do these patterns, trends, and anomalies shed light on the problem/opportunity you identified?
- Leveraging your work in the Discussion Questions and the guidance from our course materials, include charts, tables, and/or other visual supports to ensure that your data tells a clear story that your reader can easily
© Strayer University. All Rights Reserved. This document contains Strayer University confidential and proprietary information and may not be copied, further distributed, or otherwise disclosed, in whole or in part, without the expressed written permission of Strayer University.
3. Conclusion and Action Items
- What does your analysis tell you about where you should focus your efforts to drive meaningful improvement?