BCG Matrix – Dell
| Industry Sales Growth Rate
(Percentage) |
Relative Market Share Position | ||
| High +20
Medium 0
Low -20 |
High Medium Low
1.0 .50 0.0 |
||
| Stars II
|
Question Marks I
|
||
| Cash Cows III
|
Dogs IV
|
||
Source (David, 2013; based on BCG Portfolio Matrix from the Product Portfolio Matrix, © 1970, The Boston Consulting Group)
This template (adapted from Fred R. David, Strategic Management: Concepts and Cases. (13th ed.) can be adjusted, the circle can be deleted, adjusted for size, and the test can be entered, etcetera.
| Division/Unit | Revenue (in Millions) | % Revenue | Profits (in Millions) | % Profits | Market Share
(as a %) |
Growth Rate
(as a %) |
| 1. Dell PC | $ 50.02 | $27.00 | .60 | +10 | ||
| 2. Cloud Computing | $25.00 | $15.00 | .20 | +9 | ||
| 3. Dell Monitors | $10.60 | $8.60 | .15 | +4 | ||
| 4. Cell phones | $5.00 | -$3.00 | .03 | -5 | ||
| Total | $90.62 | $47.00 | ||||
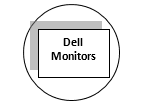
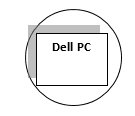
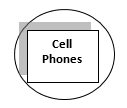
Presented above is a BCG matric for Dell technologies. There are four main divisions of the company evaluated in the matrix; Dell PC, Dell Monitors, Cloud Computing, and Cell Phones.
The stars in the analysis represent the products with a long run opportunity for growth and profitability. These products have a high relative market share and a high industry growth rate. For Dell Technologies, the stars are the Dell Monitors. This is one of the main products that this company is known for. Dell is well-recognized in the market for the manufacture and sale of high-quality monitors used by commercial and personal customers, hence the high market share. However, compared to PCs, monitors are a relatively new product for the company. This product still has high prospects for growth.
The question marks are products with a relatively low market share but with high growth opportunities in the industry. These products tend to have high investment needs with lower cash generation but with great prospects for growth in the future. Dell’s division, which can be classified as a question mark, is cloud computing. The business recently invested in this high growth technology division. In this division, the company provides cloud computing infrastructure and services to businesses. The company does not have a high market share in this division yet. However, cloud computing is growing at a high rate, with more businesses upgrading their information and communication technology systems. Dell has an opportunity to successfully compete in this industry.
Cash cows are divisions with a high market share but with a low industry growth rate. This is a type of market that has reached its full potential and, thus, has no prospects for further growth. Nonetheless, these products tend to have a relatively high market share and are a source of sustainable profits for a company. The cash cows at Dell are the Dell PCs. This is the original product that created recognition for the company in the market. Dell Technologies has been manufacturing and selling PCs for over five decades. This product still brings in a considerable amount of sustainable income to the company. It is also the main source of profits, as seen in the table above. However, the growth rate of this product is likely to remain constant, given the current high competition in the industry.
The dogs are the worst-performing divisions in a business. Products within this division are characterized by a low relative market share coupled with a low prospect for growth. Dogs have a weak internal and external position. A division that has become a dog causes losses for a business. In some cases, retrenchment would be the best strategy to deal with such products. However, other strategies can be applied to boost the performance of such products. For Dell Technologies, the dogs are the company’s mobile phones. The company has attempted to make smartcell phones but has failed in the market. Dell phones barely have any recognition. They have a low market share and low growth rate. These products are currently causing losses for the company, as seen in the table above.
References
David, Fred R. (2013). Strategic management: Concepts (14th ed.). Upper Saddle River, NJ: Prentice-Hall, Inc.
ORDER A PLAGIARISM-FREE PAPER HERE
We’ll write everything from scratch
Question

BCG Matrix – Dell
A BCG matrix identifies departments and divisions that should receive fewer resources than others should. It may also identify divisions that can be divested. This exercise provides you with practice for developing a BCG Matrix.
Place five column headings at the top of a worksheet titled Divisions, Revenues, Profits, Market Share Position, and Industry Growth Rate. Assess your organization’s key divisions, as outlined in the Strategic Management textbook in Figures 6-7, 6-8, and 6-9 (Chapter 6, eBook).
Next, complete a BCG Matrix for your project organization. Review published assignments from other learners or compare and discuss results with people from your organization. Submit and publish your matrix along with your worksheet information as an attachment in the assignment area. Be sure to publish this assignment so you can compare your matrix with the submissions of other learners.


