Report – Selling Price and Area Analysis for D.M. Pan National Real Estate Company
Introduction
In today’s competitive real estate industry, the use of data to gain valuable insights is no longer optional but indispensable. Real estate professionals use different statistical tools to advise sellers and buyers better. Since the cost of housing remains the largest expense for most families, it becomes important to understand how to predict listing prices based on a few key factors, including square footage. Notably, this report relates the sizes in square feet to the respective listing prices of properties. The aim is to give the D.M. Pan Real Estate Company an idea of how square footage relates to price in a specific region and how that region compares to national trends. Real estate professionals can then identify such factors and give better advice to clients on how to make wiser decisions when selling or buying properties.
Generate a Representative Sample of the Data
The sample was collected in the West South Central region for analysis purposes. This region provides a good mix of housing where reliable data on pricing trends could be ascertained. Data used in this analysis was derived from a random sample of 30 properties sold in this region to ensure that the findings are not biased by any particular housing trends or anomalies in the data set.
Random number generation was used to generate a column of random numbers with the `rand()` function and sort the properties in that column. The first 30 properties from that sorted list were selected to be the sample for analysis. This approach ensures an equal chance for each property to be selected, hence truly representative.
Summary statistics for the sample include the mean and median listing price and the square footage of the properties. For example, for properties in this sample from the West South Central region, the mean listing price is $274,933, while the medial listing price is $263,600. The standard deviation of the prices is $91,473, indicating a rise, but it reflects only part of the property value variations one would expect to see from across the nation as a whole. The average square footage for the properties is 2,148 square feet, with a median of 1,905 square feet. The standard deviation of the square footage is 879 square feet, indicating fairly good dispersion in the size of the homes in this region.
Analyze Your Sample
These sample statistics should be contrasted with national data to determine how representative the regional sample might be of the national market. The national mean price is $342,365, an average almost 25% higher than the regional mean price. Similarly, the national median price of $318,000 is well above the sample median price of $263,600. These differences suggest that, generally, homes might be more affordable in the West South Central region than in the nation as a whole. Several factors may create these differences: lower cost of living in this part of the country or diversion in supply and demand from greater metropolitan areas on the coasts.
Measured by square footage, the regional average of 2,148 square feet outpaces the national average of 2,111 square feet. The regional median at 1,905 square feet also tops the national median at 1,881 square feet. The standard deviations in square footage are close, with the regional sample showing 879 square feet and the national dataset showing 921 square feet. This implies that though homes may be larger than those in this region of the nation, it is not significant enough to account for the lower listing prices. Instead, the lower cost of housing may be more related to market conditions, demand, and economic factors associated with a particular region.
This randomness of the sample selected is further bolstered by the strategy applied to make it random. The random selection reduces bias and ensures that the properties selected are representative of the prevailing trends in the area. Using the `rand()` function, each property in the West South Central dataset had an equal chance of being selected. This makes the analysis more reliable and reflective of how things happen in the real world as regards the housing market.
Generate Scatterplot
Observe Patterns
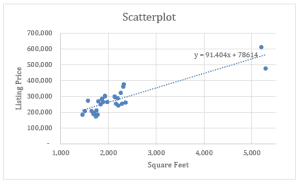
Above is the scatterplot of the sample data, which shows important features of the association between square footage and listing price. The scatterplot with square footage on the x-axis and listing price on the y-axis reflects a fairly strong positive association between the two variables. That is, as the size of a property increases, the listing price tends to go up. Such a pattern comports with expectations in real estate markets, where larger homes generally command higher prices.
The scatterplot above has a trendline, confirming that the nature of the relationship is linear. The regression equation is y = 91.404x + 78614. Using this equation, one could predict the Listing Price for any house based on square footage size. Suppose the square footage of any house is 1800. Then, applying the above equation, the listing price will be predicted as follows:
y = 91.404(1800) + 78614
= 164,527.2 + 78614
= 243,141.2
The value, according to the regression model, would, therefore, be approximately $243,141 for a house with 1,800 square feet. A predictive tool of this sort can be quite helpful to the real estate agent as one might advise a client on how much to ask for a home based on its size.
In this analysis, the independent variable (x) is the size of a property in square feet, whereas the dependent variable (y) is the price of the property. Square footage is useful for predicting the price of a home because it generally speaks as one of the home characteristics that dictates the price of a home. Attached and semi-detached houses cost more than single detached houses because they possess comparatively bigger areas and probably a higher price of construction and maintenance.
From the scatterplot, it is evident that there is a positive correlation between square footage and the listing price. Huge properties are expensive compared to small properties, and the listing price tends to rise with the increase in the size of the property. This association is common in real estate markets, especially when size is used as the benchmark to determine value. This is seen from the trend line, where there is a direct relationship between the profits of gyms and revenues from personal trainers.
According to the regression equation that connected square footage with the listing price, the relation between them is linear. This is evident from the scatter plot test as well as the calculated regression equation, which is a straight-line equation between the two variables. In this case, a linear model is appropriate because the increase in listing price seems to be directly proportional to the increase of the size of the house in terms of square footage.
There is also some data dispersion evidenced by the presence of outlying points near the upper right corner of the graph, meaning they are located outside the regular trend. These may yield outliers attributed to some complex characteristics of the listed properties or even some lucrative property locations that call for high listing prices other than their size. Still, it might just as well be huge houses with high co-efficient merely because of their size and proportion. Those seen here do not fit the trend of rising price with rising square footage but the information they bring about the heterogeneity of the houses in the dataset is still important.
The outliers may have appeared due to the presence of properties that are exceptional in some way. For example, a large luxury home with high-end amenities may be priced significantly higher than other homes of similar size. Alternatively, some homes may be located in neighborhoods with significantly higher property values, causing them to be listed at a higher price than expected based on square footage alone. These outliers represent the complexity of real estate markets, where factors other than size, such as location, amenities, and market conditions, can play a significant role in determining price.
Conclusion
To conclude, the analysis of the West South Central regional real estate market reveals a clear relationship between square footage and listing price. The positive linear association of the two variables shows that larger homes generally have higher listing prices. This is consistent with national trends; however, there are larger homes offered for lower prices in the nation’s West South Central region. The scatterplot and regression equation show useful tools for the prediction of listing prices by size of property to be possibly used by the D.M. Pan Real Estate Co. in giving better advice to its clients. Understanding regional differences and using data-driven insights provide a competitive advantage for the company in the real estate market.
ORDER A PLAGIARISM-FREE PAPER HERE
We’ll write everything from scratch
Question 
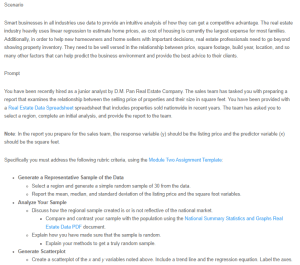
Scenario
Smart businesses in all industries use data to provide an intuitive analysis of how they can get a competitive advantage. The real estate industry heavily uses linear regression to estimate home prices, as cost of housing is currently the largest expense for most families. Additionally, in order to help new homeowners and home sellers with important decisions, real estate professionals need to go beyond showing property inventory. They need to be well versed in the relationship between price, square footage, build year, location, and so many other factors that can help predict the business environment and provide the best advice to their clients.
Selling Price and Area Analysis for D.M. Pan National Real Estate Company
Prompt
You have been recently hired as a junior analyst by D.M. Pan Real Estate Company. The sales team has tasked you with preparing a report that examines the relationship between the selling price of properties and their size in square feet. You have been provided with a Real Estate Data Spreadsheet spreadsheet that includes properties sold nationwide in recent years. The team has asked you to select a region, complete an initial analysis, and provide the report to the team.
Note: In the report you prepare for the sales team, the response variable (y) should be the listing price and the predictor variable (x) should be the square feet.
Specifically you must address the following rubric criteria, using the Module Two Assignment Template:
- Generate a Representative Sample of the Data
- Select a region and generate a simple random sample of 30 from the data.
- Report the mean, median, and standard deviation of the listing price and the square foot variables.
- Analyze Your Sample
- Discuss how the regional sample created is or is not reflective of the national market.
- Compare and contrast your sample with the population using the National Summary Statistics and Graphs Real Estate Data PDF document.
- Explain how you have made sure that the sample is random.
- Explain your methods to get a truly random sample.
- Discuss how the regional sample created is or is not reflective of the national market.
- Generate Scatterplot
- Create a scatterplot of the x and y variables noted above. Include a trend line and the regression equation. Label the axes.
- Observe patterns
- Answer the following questions based on the scatterplot:
- Define x and y. Which variable is useful for making predictions?
- Is there an association between x and y? Describe the association you see in the scatter plot.
- What do you see as the shape (linear or nonlinear)?
- If you had a 1,800 square foot house, based on the regression equation in the graph, what price would you choose to list at?
- Do you see any potential outliers in the scatterplot?
- Why do you think the outliers appeared in the scatterplot you generated?
- What do they represent?
- Answer the following questions based on the scatterplot:
You can use the following tutorial that is specifically about this assignment. Make sure to check the assignment prompt for specific numbers used for national statistics and/or square footage. The video may use different national statistics or solve for different square footage values.