Report – Selling Price and Area Analysis for D.M. Pan National Real Estate Company
Prices in the real estate industry are based on estimations based on important factors evaluated by both home sellers and homeowners. Determining the appropriate price to accord to a real estate product has remained a challenge due to the existence of a variety of factors that can be used to determine the price. Region and the area of the real estate remain the most important factors. However, regional data is qualitative and thus cannot provide a precise method of determining and forecasting prices. Additionally, price determination based on region is subjective based on the taste, attitude, and unique needs of the homeowner and seller; thus, different people may allocate different prices for one real estate product. The area of real estate is a more accepted method of price determination as it incorporates cost factors and the utility of the real estate and avoids subjectivism as the data is quantitative. This analysis seeks to establish the relationship between selling price and size in square feet of real estate in order to provide a basis for estimating real estate’s selling price.
Hire our assignment writing services to save yourself tons of time and energy required for your assignment papers.
Representative Data Sample
The East North Central region of the US will be used as the representative region from which samples will be drawn. The region has 100 samples, from which 30 samples will be selected. The region has five states, which have a varying number of samples. The samples are apportioned to each state on a pro-rata basis on the number of samples (Jud & Seaks, 1994). Il has 7 samples, In 4 samples, Mi 6 samples, Oh 10 samples, and Wi 3 samples. Measures of tendency and deviation on the two variables yield the following results:
| Measure/Variable | Listing Price | Square Foot |
| Mean | 233,746.67 | 1,791.57 |
| Median | 225,600.00 | 1,645.00 |
| standard deviation | 66,439.63 | 658.91 |
Data Analysis
There are ten regions available: East North Central, West South Central, East South Central, Northeast, West North Central, Mid Atlantic, South Atlantic, Mountain, England, and Pacific. The prices in the ten regions differ in terms of measures of central tendencies and deviations. However, the listing prices in East North Central are relatively more stable than in the other regions, as indicated by the standard deviation. In the recent past, real estate prices have greatly fluctuated in many regions, but in East North Central, prices have remained relatively stable with a sustained increase over time, which can be directly attributed to increasing demand, interest rate, economic growth, and inflation rate. Additionally, the average prices in the region lie at a central position with the other regions. This makes East North Central a perfect region for this analysis.
The East North Central Region has 100 samples drawn from five states in the region, out of which 30 samples are required for the analysis. The stratified sampling method is applied when selecting samples from the region. The five states in the region form the clusters to create a diverse state sample. The number of samples from each state is made proportionately to the number of samples available in each state. The systematic sampling method is applied to select samples from each state depending on the number of samples required from each state. The presence of states offers a convenient means of forming strata. The combination of the two methods in selecting samples from the sample frame ensures the accuracy and representativeness of the samples selected (Turner, 2020). The methods thereby reduce the chances of biasness in the samples and thus the accuracy of the analysis.
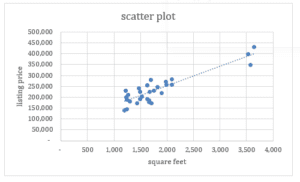
Scatterplot
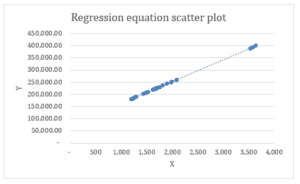
The regression equation is estimated as follows:
Y = 72930 + 89.763X
The Pattern
The simple linear regression model is used in establishing the relationship between listing price and area in square feet. The listing price assumes the dependent variable (Y), while the area in square feet assumes the independent variable (X), where the area in square feet will be used to estimate the price of real estate. The relationship between the two variables can be described as a strong positive relationship. This is evidenced by a positively oriented scatter plot of the two variables. Additionally, a linear regression of the two variables generates a positively sloped scatter plot. Both the R2 and the adjusted R2 are greater than 78%, implying that more than 78% of changes in listing prices can be explained by changes in the square feet area.
There exist several outliers in the data set whose values are significantly larger than the rest of the values in the data set. The outliers may exist due to the strength of other factors influencing listing prices not included in the model in certain areas (Yusof & Ismael, 2012). However, the outliers align with the general direction of the slope.
If one had an 1800 square foot house, the price may be estimated using the regression as:
Price = 72930 + 89.763*1800
Price = 72930 + 161573.4 = $ 234503.4
The house can be sold at a price of $ 234503.4, where $ 72930 of the price is the fixed price irrespective of the size of the house, and $ 234503.4 of the price can be attributed to the area in square feet.
References
Jud, G. & Seaks, T. (1994). Sample selection bias in estimating housing sales prices. The Journal of Real Estate Research, 9(3), 289-298.
Turner, D. P. (2020). Sampling Methods in Research Design. Headache: The Journal of Head and Face Pain, 60(1), 8–12.
Yusof, A. & Ismael, S. (2012). Multiple regressions in analyzing house price variations. Communications of the IBIMA (2012), 1-9.
ORDER A PLAGIARISM-FREE PAPER HERE
We’ll write everything from scratch
Question
Scenario
Smart businesses in all industries use data to provide an intuitive analysis of how they can get a competitive advantage. The real estate industry heavily uses linear regression to estimate home prices, as the cost of housing is currently the largest expense for most families. Additionally, in order to help new homeowners and home sellers with important decisions, real estate professionals need to go beyond showing property inventory. They need to be well versed in the relationship between price, square footage, build year, location, and so many other factors that can help predict the business environment and provide the best advice to their clients.

Selling Price and Area Analysis for D.M. Pan National Real Estate Company
Prompt
You have been recently hired as a junior analyst by D.M. Pan Real Estate Company. The sales team has tasked you with preparing a report that examines the relationship between the selling price of properties and their size in square feet. You have been provided with a Real Estate Data spreadsheet that includes properties sold nationwide in recent years. The team has asked you to select a region, complete an initial analysis, and provide the report to the team.
Note: In the report you prepare for the sales team, the response variable (y) should be the listing price, and the predictor variable (x) should be the square feet.
Specifically, you must address the following rubric criteria using the Module Two Assignment Template:
- Generate a Representative Sample of the Data
- Select a region and generate a simple random sample of 30 from the data.
- Report the mean, median, and standard deviation of the listing price and the square foot variables.
- Analyze Your Sample
- Discuss how the regional sample created is or is not reflective of the national market.
- Compare and contrast your sample with the population using the National Statistics and Graphs document.
- Explain how you have made sure that the sample is random.
- Explain your methods to get a truly random sample.
- Discuss how the regional sample created is or is not reflective of the national market.
- Generate Scatterplot
- Create a scatterplot of the x and y variables noted above and include a trend line and the regression equation
- Observe patterns
- Answer the following questions based on the scatterplot:
- Define x and y. Which variable is useful for making predictions?
- Is there an association between x and y? Describe the association you see in the scatter plot.
- What do you see as the shape (linear or nonlinear)?
- If you had a 1,800-square-foot house, based on the regression equation in the graph, what price would you choose to list?
- Do you see any potential outliers in the scatterplot?
- Why do you think the outliers appeared in the scatterplot you generated?
- What do they represent?
- Answer the following questions based on the scatterplot:


