Relationship between Age and Strength
Hypothesis 1a and 1b: Relationship between Age and Strength
Null Hypotheses
1a. H₀: There is no correlation between age and strength (r = 0). 1b. H₀: Age does not have a predictive relationship with strength (β = 0).
Analysis Approach
For hypothesis 1a, Pearson correlation was used to examine the relationship between age and strength. For hypothesis 1b, simple linear regression was conducted to assess age as a predictor of strength. Both variables were measured at the ratio level.
Assumptions
- Both variables are continuous and measured at interval/ratio level
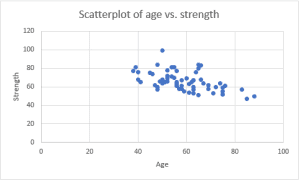
- The scatterplot (Figure 1) showed a linear relationship
- No significant outliers were present
- The data points showed approximate homoscedasticity
Results
Correlation Analysis: The scatterplot of age versus strength (Figure 1) displays data points that follow a downward trend from the upper left to the lower right, suggesting a moderate negative relationship between the variables. This indicates that as age increases, strength tends to decrease in this sample of rheumatology clinic patients.
Regression Analysis: A simple linear regression was conducted to assess the ability of age to predict strength levels. Age explained 25.9% of the variance in strength (R² = 0.259). The model was statistically significant (F(1,60) = 20.98, p < 0.001). For each one-year increase in age, strength decreased by 0.46 points (b = -0.46, p < 0.001). The regression equation is:
Strength = 92.95 – 0.46(Age)
Summary of Findings: The Pearson correlation analysis revealed a moderate, negative correlation between age and strength (r = -0.509, n = 62, p < 0.001), with higher age associated with lower strength levels. The linear regression analysis confirmed that age significantly predicts strength levels among the rheumatology clinic patients. These findings support both hypothesis 1a, that there is a negative correlation between age and strength, and hypothesis 1b, that age has a predictive relationship with strength.
Table 1: Correlation between Age and Strength
| Age | Strength | |
| Age | 1 | |
| Strength | -0.509 | 1 |
Figure 1: Scatterplot of Age vs. Strength
Hypothesis 2: Association between Exercise and Pain
Null Hypothesis
H₀: There is no association between exercise frequency and pain (they are independent).
Analysis Approach
The chi-square test for independence was used to examine the association between exercise frequency and pain, as both variables are categorical.
Assumptions
- Both variables are categorical
- Observations are independent
- Expected frequencies in each cell are greater than 5
Results
The crosstabulation of exercise frequency by pain (Table 2) shows different patterns of exercise frequency between those who report daily moderate pain and those who do not. Among patients reporting pain (n=22), there was an equal distribution across exercise frequency categories (31.8% for each of the “never” and “1-2x weekly” categories and 36.4% for “>2x week”). In contrast, among patients not reporting pain (n=40), a larger proportion exercised 1-2 times weekly (45.0%) or more than twice weekly (37.5%), with only 17.5% never exercising.
A Chi-square test for independence indicated a significant association between exercise frequency and pain (χ² = 11.16, df = 2, p = 0.004). This suggests that pain level and exercise frequency are related in this population of rheumatology clinic patients.
Summary of Findings: The analysis revealed a statistically significant association between exercise frequency and daily moderate pain. Patients who did not report pain were more likely to engage in regular exercise compared to patients who reported pain. These findings support hypothesis 2 that there is an association between exercise and pain in this sample.
Table 2: Crosstabulation of Exercise Frequency by Pain
| Never (1) | 1-2x Weekly (2) | >2x Weekly (3) | Total | |
| Pain (1) | 7 | 7 | 8 | 22 |
| No Pain (2) | 7 | 18 | 15 | 40 |
| Total | 14 | 25 | 23 | 62 |
Count of exerColumn Labels Row Labels123Grand TotalGrand Total14252362
| Expected Values | (O – E )^2/E | ||||||||||||||
| 1 | 2 | 3 | 1 | 2 | 3 | ||||||||||
| 1 | 7 | 7 | 8 | 22 | 1 | 4.967742 | 8.870968 | 8.16129 | 1 | 0.831378 | 0.394604 | 0.165243 | |||
| 2 | 7 | 18 | 15 | 40 | 2 | 9.032258 | 16.12903 | 14.83871 | 2 | 0.457258 | 5.167032 | 4.140884 | |||
| X2 | 11.1564 | ||||||||||||||
| df | 2 | ||||||||||||||
| p-value | 0.003779 | ||||||||||||||
ORDER A PLAGIARISM-FREE PAPER HERE
We’ll write everything from scratch
Question 
Relationship between Age and Strength
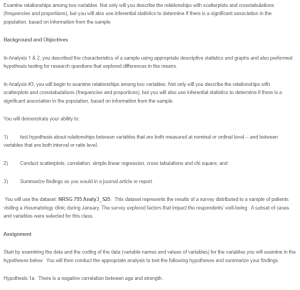
Examine relationships among two variables. Not only will you describe the relationships with scatterplots and crosstabulations (frequencies and proportions), but you will also use inferential statistics to determine if there is a significant association in the population, based on information from the sample
Relationship between Age and Strength
Background and Objectives
In Analysis 1 & 2, you described the characteristics of a sample using appropriate descriptive statistics and graphs and also performed hypothesis testing for research questions that explored differences in the means.
In Analysis #3, you will begin to examine relationships among two variables. Not only will you describe the relationships with scatterplots and crosstabulations (frequencies and proportions), but you will also use inferential statistics to determine if there is a significant association in the population, based on information from the sample.
You will demonstrate your ability to:
1) test hypothesis about relationships between variables that are both measured at nominal or ordinal level — and between variables that are both interval or ratio level.
2) Conduct scatterplots, correlation, simple linear regression, cross tabulations and chi square; and
3) Summarize findings as you would in a journal article or report.
You will use the dataset: NRSG 795 Analy3_S25. This dataset represents the results of a survey distributed to a sample of patients visiting a rheumatology clinic during January. The survey explored factors that impact the respondents’ well-being. A subset of cases and variables were selected for this class.
Assignment
Start by examining the data and the coding of the data (variable names and values of variables) for the variables you will examine in the hypotheses below. You will then conduct the appropriate analysis to test the following hypotheses and summarize your findings.
Hypothesis 1a. There is a negative correlation between age and strength.
Hypothesis 1b. Age has a predictive relationship with strength.
Hypothesis 2. There is a association between exercise and pain
For each hypothesis summarize the information for the following steps in your write up:
1. State the null hypothesis.
- Decide how to analyze the relationship.
- Check the necessary assumptions for the statistical tests you choose (provide evidence of what you did to check).
- Create scatterplot or cross tabulation table as appropriate.
- Calculate the p-value for the appropriate statistical test, and assess whether the hypothesis was supported or not.
- Prepare a summary of the findings in a paragraph using your OWN words, citing both the descriptive results and the testing of the hypothesis. Include figures or tables to show your findings. Note: you may integrate the summary for hypothesis 1a & 1b together but remember to still mention test specific information
- Include IS resulted output tables or the Excel output tables showing your work.
See the examples below for descriptions of findings from another database. The paragraphs can be SINGLE SPACED (save space). This whole assignment should be no more than 2 pages not counting the output tables.
- Example of how a result may be written for a Pearson correlation:
The scatterplot of the scores on the Beck Depression Inventory and the scores for Quality of Life showed that the points are in a narrow cigar shape from the upper left hand corner to the lower right hand corner. This would indicate a moderate to strong negative relationship between depression and quality of life. The strength and significance of the relationship between depression and quality of life was investigated using the Pearson Product Moment correlation. There was a large, negative correlation between the two variables (r=-.54, n=156, p=.007), with higher levels of depression associated with lower levels of quality of life.
- This is an example of how results may be written for a Chi-Square test:
The crosstabulation of smoking by gender showed that the proportion of women who smoked (18%) was similar to men (20%). A Chi-square test for independence indicated no significant association between gender and smoking (p=.34, n=220).
- This is an example of how results may be written for a simple linear regression:
A simple linear regression was conducted to assess the ability of Internal Locus of Control to predict Perceived Stress. Locus of control explained 6% of the variance in perceived stress (R2=.06). The Model was significant (F=13.2, p=.008). For each point increase in locus of control, perceived stress decreased by 2.4 points (b=-2.4, p=.01).