MAT240: Module Five Assignment
Introduction
The real estate industry is highly dynamic; market conditions are what sometimes force these companies to alter things so they remain competitive. In advertising, companies try to differentiate their advertising strategy with prospective buyers, thereby increasing the value of property. In a recent development, the Regional Real Estate Company’s salesperson has recently unveiled an advertisement that claims its ability to bring in a higher average cost per square foot of homes in the Pacific region. The specific point of the salesperson was that the average cost per square foot for the Pacific was less than $280—the average from previous home sales in the area.
To check this claim before the company launches the new advertisement, a hypothesis test had to be conducted by taking a sample of homes in the Pacific region. This paper discusses how the random sample was selected, a hypothesis test was conducted, data was analyzed, and results were interpreted to determine whether the claim made by this salesperson holds up statistically. The significance level of this test is 0.05.
The sample is being drawn to make sure the analysis is based on a representative sample of homes. A random sample of 750 homes has been selected from the Pacific region. Results were randomly generated using the `=Rand()` function in Microsoft Excel, which assigns random numbers to each home in the dataset. This dataset was then sorted using these random numbers, and the first 750 homes were selected as part of the sample. This ensured that the selection process was free of bias and purely random, a critical assumption for hypothesis testing.
Hypothesis Test Setup
The hypothesis test seeks to determine if the average cost per square foot in the Pacific region really is less costly than $280, the salesperson claims. The value of interest for the population with which it is associated is u, for which we want to estimate the average cost per square foot. The hypotheses for this left-tailed test are as follows:
(H₀): u = 280
(H₁): u < 280
The mean cost per square foot is $280 under the null hypothesis (H₀), so the alternative hypothesis (H₁) asserts the true average is less than $280. It is a left-tailed test of which we only have interest that the actual mean lies below the hypothesized value of $280.
For this test, this significance level is 0.05 — if the p-value is smaller than 0.05, the null hypothesis will be rejected in favor of the alternative hypothesis. However, if the p-value > 0.05, we will reject the null hypothesis.
Data Analysis Preparations
Summary Statistics
Before performing the hypothesis test, it is important to examine the descriptive statistics of the random sample. The following summary statistics were calculated in Excel:
| Square footage | |
| Mean | 1902.55962 |
| Standard Error | 8.91035615 |
| Median | 1875.5 |
| Mode | 1840 |
| Standard Deviation | 244.020153 |
Histogram
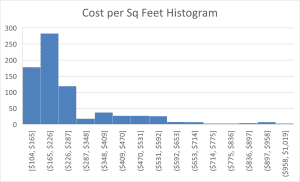
The hypothesized mean cost per square foot in the sample of $280 is below the mean of $262. Here, these data have spread between themselves, and there is a huge deviation by Standard Deviation, that is $244.02. Since the sample median is close to the mean, we can say that this distribution is not too far off from being symmetric. The histogram above shows most of our data lying between $165 and $226 per square foot, but there are some homes that cost more than $500 per square foot, which makes this data right-skewed.
It can be seen that the data is right-skewed, confirming the shape of the histogram. However, one can assume that in view of the large sample size (750), the Central Limit Theorem holds. This means that the sample mean has an approximately normal sampling distribution. This thus allows one to carry on the hypothesis test.
Calculations
The next step was to calculate the test statistic, which measures how far the sample mean is from the hypothesized mean of $280 in terms of standard errors. These calculations were completed in Excel, and the following information was determined.
| Mean (Sample): | $262 |
| Target Mean | $280 |
| Standard Error | $5.81 |
| Test Statistic (t) | -3.04480817 |
| Degrees of Freedom | 760-1=749 |
Next, the p-value is calculated based on the test statistic using a left-tailed t-distribution. Since it is a left-tailed test being conducted, the Excel formula `=T.DIST(test statistic, degrees of freedom, 1)` was used to compute the p-value. The p-value was determined to be as follows:
| Left Tailed Test | |
| H0: u = 280 | |
| H1: u < 280 | |
| p-value | 0.00120493 |
Test Decision
At a significance level of 0.05, the p value is less than 0.0012. The test rejects the null hypothesis because the p value is smaller than 0.05. This means that the average cost per square foot in the Pacific region is less than $280, which substantiates a salesperson’s argument.
Conclusion
After carrying out the test, the results indicate strong evidence that the average cost per square foot in the Pacific region is less than $280. Since the p value of 0.0012 is so much less than .05, you will have good reason to reject the null hypothesis. As a result, the new advertisement was not found to be associated with a higher average cost per square foot. The fact is that the average cost is less than the expected value of $280.
The result is statistically significant, suggesting that this did not happen by random chance. Considering the advertisement campaign, a company should not solely base decisions on the cost per square foot but should consider other information. Additional analysis in terms of other metrics, such as the number of home sales or time to sell homes, may help provide insight into the overall effectiveness of an advertisement.
However, the statistical test in this research indicates the salesperson’s claim has evidence. The evidence sustains the argument that the average cost per square foot is less than $280 across the Pacific region. While this is a significant statistical result, such findings need to be put into perspective between other variables associated with home prices in the housing market.
ORDER A PLAGIARISM-FREE PAPER HERE
We’ll write everything from scratch
Question 
MAT 240 Module Five Assignment Guidelines and Rubric
Scenario
You have been hired by the Regional Real Estate Company to help them analyze real estate data. One of the company’s Pacific region salespeople just returned to the office with a newly designed advertisement. The average cost per square foot of home sales based on this advertisement is $280. The salesperson claims that the average cost per square foot in the Pacific region is less than $280. In other words, he claims that the newly designed advertisement would result in higher average cost per square foot in the Pacific Region. He wants you to make sure he can make that statement before approving the use of the advertisement. In order to test his claim, you will generate a random sample of size 750 houses using data for the Pacific region and use this data to perform a hypothesis test.
MAT240: Module Five Assignment
Prompt
Generate a sample of size 750 houses using data for the Pacific region. Then, design a hypothesis test and interpret the results using significance level α = .05. You will work with this sample in this assignment. Briefly describe how you generated your random sample.
Use the House Listing Price by Region document to help support your work on this assignment. You may also use the Descriptive Statistics in Excel PDF and Creating Histograms in Excel PDF tutorials for support.
Specifically, you must address the following rubric criteria, using the Module Five Assignment Template Word Document
- Introduction: Describe the purpose of this analysis and how you generated your random sample size of 750 houses.
- Hypothesis Test Setup: Define your population parameter, including hypothesis statements, and specify the appropriate test.
- Define your population parameter.
- Write the null and alternative hypotheses.
- Specify the name of the test you will use.
- Identify whether it is a left-tailed, right-tailed, or two-tailed test.
- Data Analysis Preparations: Describe sample summary statistics, provide a histogram and summary, check assumptions, and identify the test significance level.
- Provide the descriptive statistics (sample size, mean, median, and standard deviation).
- Provide a histogram of your sample.
- Summarize your sample by writing a sentence describing the shape, center, and spread of your sample.
- Check whether the assumptions to perform your identified test have been met.
- Identify the test significance level. For example, α = .05.
- Calculations: Calculate the p value, describe the p value and test statistic in regard to the normal curve graph, discuss how the p value relates to the significance level, and compare the p value to the significance level to reject or fail to reject the null hypothesis.
- Calculate the sample mean and standard error.
- Determine the appropriate test statistic, then calculate the test statistic.
- Note: This calculation is (mean – target)/standard error. In this case, the mean is your regional mean (Pacific), and the target is 280.
- Calculate the p value using one of the following tests.
- Choose your test from the following:
- =T.DIST.RT([test statistic], [degree of freedom]): right-tailed test
- =T.DIST([test statistic], [degree of freedom], 1): left-tailed test
- =T.DIST.2T([test statistic], [degree of freedom]): two-tailed test
- Note: The degree of freedom is calculated by subtracting 1 from your sample size.
- Choose your test from the following:
- Using the normal curve graph as a reference, describe where the p value and test statistic would be placed.
- Test Decision: Compare the relationship between the p value and the significance level, and decide to reject or fail to reject the null hypothesis.
- Compare the relationship between the p value and significance level.
- Decide to reject or fail to reject the null hypothesis.
- Conclusion: Discuss how your test relates to the hypothesis and discuss the statistical significance.
- Explain in one paragraph how your test decision relates to your hypothesis and whether your conclusions are statistically significant.
You can use the following tutorial that is specifically about this assignment:
What to Submit
Submit your completed Module Five Assignment Template as a Word document that includes your response, supporting charts/graphs, and your Excel file.