Impact of the 1973 Oil Embargo on US Economic Activity
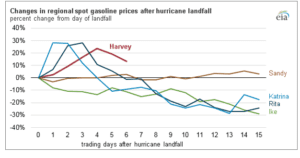
The United States has experienced several natural disasters. Among these are Hurricane Katrina, Harvey, Sandy, and Rita (EIA, 2017). These hurricanes usually cause harm to people, the environment, and infrastructure. As a result, the prices of oil tend to undergo rapid increments as supply drops dramatically and demand either increases or remains constant. In 2017, Hurricane Harvey swept through the Eastern and Gulf Coast of the USA. This disrupted the supply of gasoline because refineries experienced power blackouts. The price of gasoline increased by up to 41 cents from the previous week. The price of every gallon changed significantly (EIA, 2017). As shown in the graph below, different hurricanes exhibited or caused varying gasoline price changes on different days of trading. Do you need help with your assignment ? Reach out to us at eminencepapers.com.
Source: (EIA, 2017)
The effect of the disaster on oil prices seems to ripple from the production step. When refineries gradually shut down, this means that the process will increase steadily as demand intensifies or increases and supply reduces. Most of the refineries that resume operations do so at reduced rates of production, affecting the suppliers’ ability to meet demand (Karp, 2005).
Natural disasters such as Katrina affected the supply and demand of oil by hitting the rigs. Offshore natural gas and crude production bore a massive disruption when Hurricane Katrina hit. Louisiana’s pipeline was destroyed. Most importantly, people lose their jobs and remain unemployed for some time. The lack of financial resources inhibits the people’s ability to purchase commodities. Thus, the spending power of consumers is affected negatively. The consumers deal with other issues, such as loss of property and family members. Demand can either increase or reduce (Karp, 2005). The fluctuation of demand highlights one of the several effects of the disaster on demand as a function of the economy.
The gasoline futures are traded publicly on the New York Mercantile Exchange. These futures set the retail prices for commodities such as gas and oil. During such periods, the American government can intervene through the Strategic Petroleum Reserve (SPR). Enacted in 1975, the SPR allows the federal government to hold petroleum products. When an emergency strikes, purchases for stockpiling are suspended. With the president’s authorization, SPR releases its products to companies for sale at the current prices in the market. This supply injection allows the companies to provide consumers with the goods. This framework is critical in sustaining the supply of petroleum products when normal supply reduces drastically or remains unreliable for unknown periods (Welborn & Flynn, 2005).
References
EIA. (2017). U.S. average retail gasoline prices increase in the wake of Hurricane Harvey. Retrieved from https://www.eia.gov/todayinenergy/detail.php?id=32792
Karp, R. (2005, September 7). Katrina and Oil Prices. (E. Pan, Interviewer) Retrieved from https://www.cfr.org/interview/katrina-and-oil-prices
Welborn, A. A., & Flynn, A. M. (2005). Price Increases in the Aftermath of Hurricane Katrina: Authority to Limit Price Gouging. CRS Report for Congress. Retrieved from https://fas.org/sgp/crs/misc/
ORDER A PLAGIARISM-FREE PAPER HERE
We’ll write everything from scratch
Question
Write a 350- to 700-word analysis assessing how 1 of the following major economic events influenced supply, demand, and economic equilibrium in the US economic activity:
Impact of the 1973 Oil Embargo on US Economic Activity
Rapid price increases, such as caused by the 1973 oil embargo or the aftermath of a major hurricane
Dramatic employment drops, such as the combined impact of the 2006 housing bubble burst and the subsequent Great Recession
Crippling interest rates by the Federal Reserve, such as those of the 1975 – 1985 time period
The collapse of the Soviet Union in 1991, the end of the Cold War, and the “peace dividend”
The dot-com bubble from 1994 to 2000 and the subsequent dot-com crash
Cite at least 2 academically credible sources. The use of charts and tables to illustrate data is highly encouraged.


