Financial Benefits Comparison
Memorandum
To: The Executive Management Board
From:
CC: Chief Technology Officer
Subject: Financial Benefits Comparison: Option A and Option B
Greetings
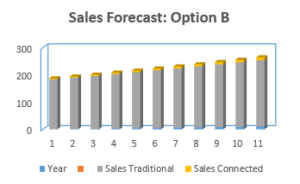
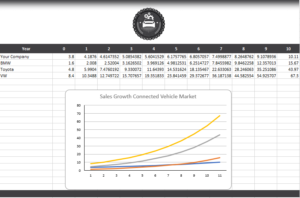
In accordance with our goal of providing the best services to our clientele, our company has been looking to incorporate Internet of Things (IoT) technology in its vehicles. To fulfill this endeavor, we have identified two viable options, Option A and Option B. To choose the best of these two options, we’ll compare the financial benefits of both options A and B using sales forecast data. Sales forecast data summarizes the potential financial reward expected for implementing either option A or option B. The company expects the sale of its traditional cars to remain the same by implementing either option A or option B in the first ten years. However, the sales of cars connected to the Internet of Things (IoT) technology are anticipated to increase when the firm implements option A than when it embraces option B. As shown in Figure 1 and Figure 2, option A will lead to sales of 4 connected cars in the first year of its implementation, with sales in the last three years recording 17, 22, and 27, respectively. Our assignment help will hone your writing prowess for papers that will awe your professors.
Figure 1: Option a forecast
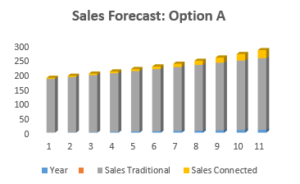
Figure 2: Option B forecast
Gross Margin
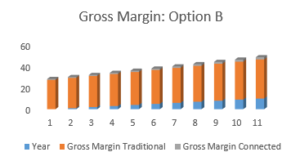
As with sales of traditional cars and cars connected to IoT, option A expected to attract a higher sales margin than option B. Particularly, option A is projected to realize a gross margin traditional of 27 in the first year and 34, 35, and 36 in the last three years, respectively. Similarly, option B is anticipated to achieve sales of 27 traditional cars in the first year and 34, 35, 36 cars in the last three years, respectively. As such, options A and B are expected to realize an incremental sales margin of digital cars, with the former option projected to realize more sales than the latter, as shown in Figure 3 and Figure 4 below.
Figure 3: Gross margin for option A
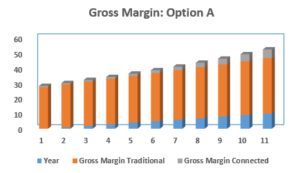
Figure 4: Gross margin for option B
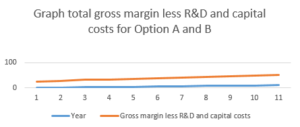
Both innovative implementation options will attract incremental gross margins with less R&D and capital costs. Even so, option A is forecasted to attract a higher value of 40.9 in the 10th year than option B with 37.3, at the end of the 10th year. As shown in Figure 5, The outcome of the forecasts demonstrates that implementing Option A will be more financially rewarding than Option B. Thus, the company is better positioned to earn more profits by implementing option A in the innovative implementation of IoT. Therefore, option A will likely fetch more profits than option B for the company as it will attract a higher sale of self-driven cars.
Figure 5: Graph total gross margin less R&D and capital costs for Option A and B
Thank you for your time and consideration.
Regards,
(Your name)
Assistant Technology Officer.
ORDER A PLAGIARISM-FREE PAPER HERE
We’ll write everything from scratch
Question 
Financial Benefits Comparison
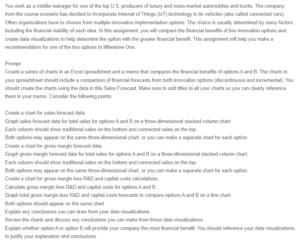
You work as a middle manager for one of the top U.S. producers of luxury and mass-market automobiles and trucks. The company from the course scenario has decided to incorporate Internet of Things (IoT) technology in its vehicles (also called connected cars). Often organizations have to choose from multiple innovative implementation options. The choice is usually determined by many factors including the financial viability of each idea. In this assignment, you will compare the financial benefits of two innovation options and create data visualizations to help determine the option with the greater financial benefit. This assignment will help you make a recommendation for one of the two options in Milestone One.
Prompt
Create a series of charts in an Excel spreadsheet and a memo that compares the financial benefits of options A and B. The charts in your spreadsheet should include a comparison of financial forecasts from both innovation options (discontinuous and incremental). You should create the charts using the data in this Sales Forecast. Make sure to add titles to all your charts so you can clearly reference them in your memo. Consider the following points:
Create a chart for sales forecast data.
Graph sales forecast data for total sales for options A and B on a three-dimensional stacked column chart.
Each column should show traditional sales on the bottom and connected sales on the top.
Both options may appear on the same three-dimensional chart, or you can make a separate chart for each option.
Create a chart for gross margin forecast data.
Graph gross margin forecast data for total sales for options A and B on a three-dimensional stacked column chart.
Each column should show traditional sales on the bottom and connected sales on the top.
Both options may appear on the same three-dimensional chart, or you can make a separate chart for each option.
Create a chart for gross margin less R&D and capital costs calculations.
Calculate gross margin less R&D and capital costs for options A and B.
Graph total gross margin less R&D and capital costs forecasts to compare options A and B on a line chart.
Both options should appear on the same chart.
Explain any conclusions you can draw from your data visualizations.
Review the charts and discuss any conclusions you can make from those data visualizations.
Explain whether option A or option B will provide your company the most financial benefit. You should reference your data visualizations to justify your explanation and conclusions.