Financial and Management Accounting Techniques for Managers
Task 1
Part a: Management and financial accounting systems
Financial accounting systems involve the collection and collation of financial information for financial reporting purposes. It communicates the financial situation of a company to various stakeholders like shareholders, government institutions, creditors, and debtors. Financial accounting systems use double-entry bookkeeping. The double-entry accounts are then collated in the trial balance, from where the income statement, balance sheet, and cash flow statement are derived. In financial accounting, there are standards that define how data is reported. For instance, standards bodies like the International Accounting Standards Board (IASB) and the Financial Accounting Standards Board (FASB) set financial accounting yardsticks that have to be followed by accountants when preparing financial accounts (Taipaleenmaki & Ikäheimo, 2009). Modern computerized systems like QuickBooks, Sage, and others help make Financial accounting simple and accurate.
Management accounts are internal documents meant for the management of the company. They focus on the internal processes of a business and try to enhance them to meet the organization’s objectives. While financial accounting primarily focuses on the bottom line and the profits generated by a business, managerial accounting looks at the processes that create profits, helping the business leadership to improve the company’s efficiency and effectiveness (Richardson, 2017). Managerial accounting reports do not involve double entry and they do not lead to the generation of the trial balance, the balance sheet, or the income statement. However, they help the management to make important business decisions by providing timely and accurate business insights. Management accounts are more detailed and may include departmental reports, product lines, regions, and clients. Most accounting/financial systems have business intelligence modules that can help in creating management reports.
Part b: Financial and management techniques used for recording financial information
Financial information can be recorded manually using tools like cash books, petty cash books, and various journal entries. Entries can also be recorded electronically using a computer system, which could be a basic financial system or an Enterprise Resource Planning (ERP) system that encompasses a broad range of functionalities like sales force management, human resource management, and project management. Cash registers can also be used by companies with large cash transactions for calculating and recording cash sales. The cash registers help in capturing the data at the source, thereby reducing the cost of re-entering the data into the system.
Task 2
The Usefulness of Financial and Management Accounting Statements to Stakeholders
Accounting and financial statements are critical to any corporation because they offer stakeholders a snapshot of the financial well-being of the business at any given point, providing an insight into the cash flow, operations, performance, and general conditions (Wadesango & Wadesango, 2016). Usually, stakeholders need this information to make informed equity investment decisions. Several tools have been designed to help shareholders to make these financial assessments. This draft paper evaluates the three types, as well as the usefulness, of management and financial accounting statements, including the cash flow statement, income statement, and balance sheet.
-
Balance Sheet
The balance sheet refers to a financial statement used to report a firm’s liabilities, assets, shareholder equity, and liabilities at a particular moment, providing a ground for calculating the rates of return on investment and computing the company’s capital structure (Stickney et al., 2009). It gives a snapshot of what the company owes, owns, and what shareholders have invested. In addition to other financial statements, the balance sheet is used to calculate financial ratios or carry out a fundamental analysis of the company. Typically, the balance sheet sticks to the formula containing assets on one part and shareholder’s equity plus assets on the other part. They are then balanced out. It is important to note that by comparing a company’s balance sheet at the moment with previous balance sheets, as well as balance sheets of other companies, it is possible for the management to determine the current market trends and how well the business is performing. Several ratios can be obtained from the balance sheet, such as the acid-test ratio and the debt-to-equity ratio, assisting stakeholders in getting a glimpse of the health of the company.
As mentioned above, the balance sheet consists of assets on one side and the shareholder’s equity plus liabilities on the other side. An asset refers to anything of value that the company owns (Kimmel, Weygandt, & Kieso, 2010). Assets are either physical or tangible items (such as real estate, office furniture, computers, and cars) or intangible items (like intellectual property). In a balance sheet, especially within the asset portion, assets are based on their liquidity from top to bottom. Assets are categorized into long-term or non-current assets (which a firm cannot switch into cash within a year) and current assets (those that can be converted). Current assets range from cash &cash equivalents (such as short-term deposit certificates and treasury bills), marketable securities, accounts receivables (the money clients owe the business), the inventory (items available for sell), to prepaid expenses (the value of the firm has already paid for, like rent, advertising contracts, and insurance). Long-term assets are classified into fixed assets (for example, equipment, buildings, machinery, land) and intangible assets (for example, goodwill and intellectual property).
Liabilities, on the other hand, are the amount of money the firm owes to external entities, such as salaries, utility bills, and so on. Liabilities are also categorized into current liabilities (such as accounts payable, wages payable, bank indebtedness, unearned and earned premiums, interest payable, dividends payables, and so on) and non-current liabilities (such as deferred tax, pension fund, and long-term debt). Finally, shareholders’ equity, sometimes called the net assets, refers to the amount of money that is attributable to a company’s shareholders.
-
Income Statement
The income statement indicates the revenues a company has obtained from the sale of services and products, the operating expenses, as well as other costs, including interest expenses and taxes. Usually, the bottom line or net amount in the income statement refers to the profit the company has netted within that particular period. It is also important to note that even though the primary objective of the income statement is to display the details of the business activities and profitability of an entity to investors, it also gives an in-depth insight into the firm’s internals – which can be used to make comparisons across various sectors and businesses (Stickney et al., 2009). Income statements are also regularly prepared at the segment and department levels to get a deeper look into how each department is progressing throughout the year. Income statement reports can help the management to make critical decisions, such as increasing production capacity, pushing sales, entering a new geographical territory, or closing a production line or department. Although creditors often find less use of income statements, perhaps because they are more concerned with future sales of a company, researchers use income statements to make yearly or quarterly comparisons. One can use this information to tell whether the decision to lower the cost of sales helped it increase profits or not.
-
Cash Flow Statement
The cash flow statement (shortened as CFS) is the final and equally important financial and management accounting statements used by stakeholders to evaluate the performance of a company (Stickney et al., 2009). The CFS evaluates the amount of cash the company has generated within a particular period and includes all the transactions subtracted from or added to cash. Some of the operating activities indicated on the cash flow statement include receipts from the sale of services and goods, income tax payments, interest payments, rent payments, payments to suppliers, wage and salary payments, and so on. Measuring cash flow is essential as it displays how much cash is available to address short-term objectives, invest in the business, or to give dividends to stockholders. In general, the CFS provides a summary of the number of cash equivalents and cash leaving and entering the firm, allowing it to measure how well money is generated to offset existing debts and finance daily operations. A balance sheet is an important requirement that complements the income statement and balance sheet.
-
Budgets
Whereas a balance sheet and income statement are used for external purposes, budgets are exclusively used for management functions. A budget is an approximation of the expenses and revenues of organizational operations within a specified timeframe. In microeconomics, the term budget implies the trade-off of the exchange of goods, with the bottom line representing profits (in case of a surplus budget), losses (deficit budget), or neither profits nor losses (balanced budget). For businesses, budgets serve three major functions: forecasting expenditures and income, an instrument for decision-making, and a tool for monitoring the performance of a business. Budgets often form an integral part of the entire planning process, with managers using them to forecast whether a company can generate profits in the long run or not. For that reason, managers usually tend to generate budgets to predict expenditures and income and, subsequently, the profitability of the business venture. In the long run, managers use budgets to estimate the real performance of an entity against the predictions. This is then used to make strategic business decisions, such as closing the company, ramping up production, and so on.
Task 3
Part a: Components of working capital
Working capital can be described as the current assets minus current liabilities; hence, the main components of the working capital for a business are its current assets and current liabilities (Sagner, 2010). Current assets comprise the assets of a business that can be converted into cash in a short period of time and include accounts receivables, inventory, and both cash and bank balances. On the other hand, current liabilities are a business’s short-term obligations, which are due for settlement in a short period and mainly comprise the accounts payables.
Trade receivables are the total amounts owed to a business by its customers arising from goods sold or services rendered on credit. Invoices issued by a business for goods and services supplied and payable within a year qualify as trade receivables. This component forms an important part of the current assets of a business and, therefore, its working capital.
Inventory is the goods held by a business for the purpose of selling. It can be in the form of raw material which the business intends to turn into finished products, work-in-progress, which comprise the material in the process of being turned into finished goods, finished goods in readiness for sale, or MRO (Maintenance, Repair, and Operating) supplies which are required in the assembly of finished goods.
Cash and bank balances are an important element of the current assets of a business and hence its working capital. This component includes cash at hand, balances available in the bank, and any other highly liquid short-term investments which are readily convertible into cash, like securities.
Accounts payable are the amount owed by a business for purchases made on credit and are due in a short period of time (Sagner, 2010). They form an integral part of current liabilities, making them an important component of the working capital. They include money owed to suppliers for goods purchased or services availed in normal business operations.
How business organizations can effectively manage working capital
To ensure effective operations and the sustainability of operations, a business should craft and implement effective working capital management techniques. Working capital management is the process of managing both short-term assets and short-term liabilities to ensure sustainable liquidity. An important aspect of working capital management is the working capital cycle, which is defined as the period taken by a business to convert its short-term assets and current liabilities into cash. A long capital cycle is troublesome for a business as more capital is tied up into working capital, which doesn’t bring returns to the business (Kipronoh & Mutambu, 2018). To effectively manage working capital, each of the components of the working capital should be considered in the plan.
Accounts Receivables
Management of accounts receivables involves the development of an effective credit policy, which includes a proper definition of the credit terms, collection period, and collection standards acceptable to both the business and its stakeholders. The business should aim to develop a debtor management policy aimed at reducing the period between sale completion and the settlement of account receivables (Kipronoh & Mutambu, 2018). This can be achieved through:
- Sending out sales invoices as soon as possible
- Frequently sending out customer statements indicating outstanding amounts
- Insist on deposits or commitment fees before finalizing a transaction
- Implementing a strict background check on the creditworthiness of new customers
- Include penalties on overdue accounts to discourage delayed payments
- Constantly review customers’ credit limits
Business Inventories
The main aim of an effective inventory management policy is to minimize the amount of cash tied up in held stock by determining the optimum level of inventory the business should maintain (Kipronoh & Mutambu, 2018). To achieve this, the business should consider the following in its inventory management plan:
- Calculate the projected sales for the period
- Evaluate the availability of raw material input and the possibilities of shortages.
- Determine market factors affecting business cycles like weather and seasons
- Determine the average supplier turnaround time
- Perform regular stock counts
- Implement effective security to minimize losses
- Eliminate or minimize wastage
Business Cash
Cash is a crucial component of the working capital, and any business in general, and its effective management determines the financial health of a business both presently and in the future. An effective cash management policy aims at identifying the optimal cash balance required to run the daily operations of the business at minimal holding costs (Kipronoh & Mutambu, 2018). An effective cash management policy should:
- Identify business cash expectations
- Identify the optimal cash balance
- Keep good relation with lenders
- Keeping tabs on cash disbursements
Accounts Payables
The management of account payables aims to manage the business’s credit purchases while closely monitoring the time factor and amount to be paid to maintain a good relationship between the business and its suppliers. Mainly, the accounts payable management plan should aim at negotiating the best credit terms for the business from its suppliers and creditors (Kipronoh & Mutambu, 2018). To effectively manage accounts payables, a business should:
- Keep a comprehensive record of all credit purchases
- Evaluate and respect business credit limit
- Negotiate best purchases terms
- Keep tabs with payment due dates
- Meet payment obligations
Part c: Ratio analysis
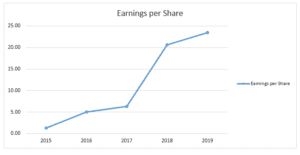
For this part, I conducted ratio analyses on the company Amazon Inc. (AMZN). The results of these analyses are shown in tables 1 to 5 below and the graphs that follow.
Table 1: Profitability Ratios
| 2015 | 2016 | 2017 | 2018 | 2019 | Average | |
| Gross Profit Margin | 33.04% | 35.09% | 37.07% | 40.25% | 40.99% | 37.29% |
| Net Profit Margin | 0.56% | 1.74% | 1.71% | 4.33% | 4.13% | 2.49% |
| Return on Assets | 0.91% | 2.84% | 2.31% | 6.19% | 5.14% | 3.48% |
| Return on Equity | 4.45% | 12.29% | 10.95% | 23.13% | 18.67% | 13.90% |
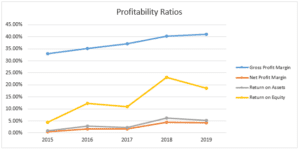
Table 2: Liquidity Ratios
| 2015 | 2016 | 2017 | 2018 | 2019 | Average | |
| Current Ratio | 1.08 | 1.04 | 1.04 | 1.10 | 1.10 | 1.07 |
| Quick Ratio | 0.77 | 0.78 | 0.76 | 0.85 | 0.86 | 0.81 |
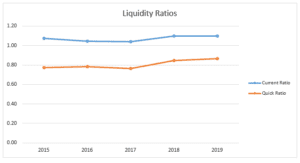
Table 3: Activity Ratios
| 2015 | 2016 | 2017 | 2018 | 2019 | Average | |
| Inventory Turnover Ratio | 6.60 | 6.42 | 6.74 | 7.39 | 16.15 | 8.66 |
| Fixed Assets Turnover Ratio | 4.90 | 2.78 | 6.11 | 3.77 | 3.86 | 4.28 |
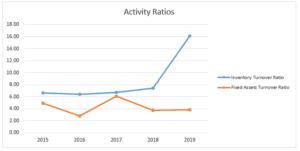
Table 4: Leverage Ratios
| 2015 | 2016 | 2017 | 2018 | 2019 | Average | |
| Debt Ratio | 73.81% | 72.34% | 68.73% | 64.28% | 65.90% | 69.01% |
| Debt to Equity Ratio | 61.53% | 39.90% | 89.30% | 53.95% | 37.73% | 56.48% |
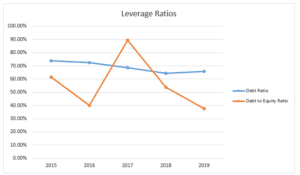
Table 5: Valuation Ratio
| 2015 | 2016 | 2017 | 2018 | 2019 | Average | |
| Earnings per Share | 1.28 | 5.01 | 6.32 | 20.68 | 23.46 | 11.35 |
Task 4
Project A is superior as it has the shortest payback period of 3.22 years, and the highest IRR, and also the highest NPV as shown in tables 6, 7 and 8. Therefore, it is recommended to proceed with project A while project D is the least favourable.
Table 6
| NPV | Project A | Project B | Project C | Project D |
| Rate percent | £ | £ | £ | £ |
| 4.5 | 1,495,891 | 107,564 | -37,372 | -38,653 |
| 5 | 1,454,256 | 96,344 | -42,533 | -46,889 |
| 5.5 | 1,413,604 | 85,353 | -47,577 | -54,935 |
| 6 | 1,373,909 | 74,585 | -52,507 | -62,797 |
Table 7
| IRR | Project A | Project B | Project C | Project D |
| Rate percent | £ | £ | £ | £ |
| 4.5 | 32.89% | 5.04% | -3.17% | -2.11% |
| 5 | 32.26% | 4.54% | -3.63% | -2.57% |
| 5.5 | 31.63% | 4.05% | -4.08% | -3.03% |
| 6 | 31.01% | 3.56% | -4.54% | -3.49% |
Table 8
| Pay Back Period | Project A | Project B | Project C | Project D |
| Rate percent | £ | £ | £ | £ |
| Year 1 | 720,000 | 600,000 | 355,000 | 520,000 |
| Year 2 | 635,000 | 325,000 | 175,000 | 325,000 |
| Year 3 | 480,000 | 25,000 | 155,000 | 275,000 |
| Year 4 | -1,670,000 | -50,000 | 145,000 | 155,000 |
| Year 5 | -1,920,000 | -220,000 | -15,000 | -45,000 |
| Payback Period (Years) | 3.22 | 3.33 | 4.91 | 4.78 |
Task 5
Part a: The total and unit costs of the finished product
Table 9: Total material cost
| Materials | Unit Price | Used (Units) in April | Total Material Cost |
| A | £ 0.48 | 314,000 | 150,720 |
| B | £ 0.84 | 76,000 | 63,840 |
| C | £ 0.22 | 72,000 | 15,840 |
| Total | 230,400 |
Table 10: Total labour and factory overheads
| Hours | Cost per hour | Total cost | |
| Direct labour hours | 3,800 | £ 8.25 | £ 31,350.00 |
| Factory Overheads | 3,800 | £ 10.00 | £ 38,000.00 |
Table 11: Total production cost/per unit cost
| Total costs | £ 299,750.00 |
| New products | 200,000.00 |
| Unit cost | £ 1.50 |
Part b: Produce an absorption costing statement showing the marginal cost.
| Absorption Costing Statement | |
| Variable cost of sales | |
| Material costs | 230,400 |
| Direct labour costs | 31,350 |
| Factory overheads | 16,889 |
| Total variable costs | 278,639 |
| Fixed cost of sales | |
| Factory overheads | 21,111 |
| Total cost of sales | 299,750 |
Part c: Calculate the materials, labour and overhead variances.
Table 12: Material variance
| Materials | Actual Price (£) | Standard Price (£) | Actual Quantity | Material Variance | Type |
| A | 0.48 | 0.5 | 314,000 | (6,280.00) | Positive |
| B | 0.84 | 0.8 | 76,000 | 3,040.00 | Negative |
| C | 0.22 | 0.2 | 72,000 | 1,440.00 | Negative |
Table 13: Labour variance
| Standard Rate (£) | Standard Hours | Actual Rate (£) | Actual Hours | Labour Variance | Type |
| 8.25 | 4,000 | 8.25 | 3,800 | 1,650.00 | Positive |
Table 14: Overhead variance
| Overhead Rate (£) | Standard Hours | Actual Overhead | Overhead Variance | Type |
| 9.00 | 4,000 | 38,000.00 | (2,000.00) | Negative |
Part d: Interpret the variance results considering both financial and non-financial factors.
The material variance is positive for material A and negative for materials B and C. The material variance is advantageous to the company when the actual price is lower compared to the standard price of the materials used. The labor rate variance is also positive because the standard rate multiplied by the standard hours is less than the actual rate multiplied by the actual hours. This variance is positive because the labor costs are lower than expected. The overhead variance is negative because the actual overhead costs are higher than the standard overhead costs.
Part e: Evaluate the use of different costing methods for pricing purposes
Different costing methods affect pricing differently because the price is determined by the cost and the expected profit margin, among other factors. Examples of costing methods include job costing, batch costing, process costing, product costing, and service costing. For instance, in batch costing, each batch will have a different cost, which may affect its price. Similarly, in job costing, costs are allocated to a particular job, affecting the pricing for that job. Therefore, different customers would get different quotes for different jobs. Other methods of costing inventory include first in, first out (FIFO), last in, first out (LIFO), and average cost. The costing method chosen affects pricing and profitability differently.
References
Cooper, D., Franklin, M., & Graybeal, P. (2019). Principles of Accounting Volume 2 – Managerial Accounting.
Kimmel, P. D., Weygandt, J. J., & Kieso, D. E. (2010). Financial accounting: Tools for business decision making. John Wiley & Sons.
Kipronoh, P., & Mutambu, T. (2018). Overview of Working Capital Management: Effective Measures in Managing Working Capital Components to Entrepreneurs. European Journal Of Business And Management, Vol.10. Retrieved 26 October 2020, from https://www.researchgate.net/publication/327435910_Overview_of_Working_Capital_Management_Effective_Measures_in_Managing_Working_Capital_Components_to_Entrepreneurs.
Richardson, A. J. (2017). The Relationship between Management and Financial Accounting The Relationship between Management and Financial Accounting as Professions and Technologies of Practice. Odette School of Business Publications, 2-17.
Sagner, J. (2010). Essentials of working capital management.
Stickney, C. P., et al. (2009). Financial accounting: An introduction to concepts, methods, and uses. Cengage Learning.
Taipaleenmaki, J., & Ikäheimo, S. (2009). On the Convergence of Financial Accounting and Management Accounting. SSRN Electronic Journal.
Tysiac, K. (2018, Nov 1). The benefits of budgeting for results. Journal of Accountancy. https://www.journalofaccountancy.com/issues/2018/nov/not-for-profit-budgeting-for-results.html
Wadesango, N., & Wadesango, V. O. (2016). The need for financial statements to disclose true business performance to stakeholders. Corporate Board: Role, Duties, and Composition, 12(2), 77-85.
ORDER A PLAGIARISM-FREE PAPER HERE
We’ll write everything from scratch
Question 
Financial and Management Accounting Techniques for Managers
Scenario
You are working as a junior accountant for a retail group, reporting to the Director of Finance.
The Director of Finance needs to produce a leaflet for new members of the Board as part of an induction pack. They are experts in a range of business fields but have limited financial knowledge.
The Director of Finance has asked you to prepare a first draft of the leaflet for his further consideration.
Task 1
The leaflet must provide an overview of financial and management accounting systems, which:
- Compares management and financial accounting systems
- analyses financial and management techniques used for recording financial information
LO1 Assessment Criteria 1.1 1.2
Merit Task
To achieve Merit, your leaflet must evaluate the benefits of financial and management accounting systems for a specific business organization
LO1 1M1
Distinction Task
To achieve a Distinction, your leaflet must evaluate how a specific business organization integrates financial and management accounting systems into their organizational processes.
LO1 1D1
Task 2
At the next meeting of the Board there is an agenda item titled ‘Discussion of financial statements and their usefulness for stakeholder groups’.
This will be led by the Regional Director of Finance.
You have received an email asking you to produce a draft paper for the Board meeting. The draft paper needs to evaluate the usefulness of financial and management accounting statements to stakeholders.
LO1 Assessment Criteria 1.3
Task 3
Due to a reduction in sales revenue and a fall in group profits the Board of Directors is investigating inventory management, credit control and current liquidity in order to make meaningful comparisons.
Your line manager has asked a few staff in the department to analyse the final accounts of competitors and you have been selected to join this group.
You need to produce a paper for a meeting with your line manager that:
- analyses components of working capital
- explains how business organizations can effectively manage working capital
- uses ratios to measure the performance of a business organization.
LO2 Assessment Criteria 2.1 2.2 2.3
Merit Task
To achieve Merit your paper must also evaluate the usefulness of ratio analysis when assessing organizational performance
LO2 2M1
Task 4
Your line manager has been pleased with your work to date and has invited you to a meeting with the Marketing Director.
The Marketing team has completed research on a number of projects to encourage customers to return to the store.
Your line manager has asked for your written comments on the financial viability of four projects.
The costs associated with each project are as follows:
| Project A | Project B | Project C | Project D | |
| £ | £ | £ | £ | |
| Initial Cost | 750,000 | 750,000 | 390,000 | 570,000 |
| Expected Cash Flow | ||||
| Year 1 | 30,000 | 150,000 | 35,000 | 50,000 |
| Year 2 | 85,000 | 275,000 | 180,000 | 195,000 |
| Year 3 | 155,000 | 300,000 | 20,000 | 50,000 |
| Year 4 | 2150,000 | 75,000 | 10,000 | 120,000 |
| Year 5 | 250,000 | 170,000 | 160,000 | 200,000 |
Table of Discount Factors
| Rate percent | ||||
| Year | 4.5 | 5.0 | 5.5 | 6.0 |
| 1 | 0.9569378 | 0.9523810 | 0.9478673 | 0.9433962 |
| 2 | 0.9157300 | 0.9070295 | 0.8984524 | 0.8899964 |
| 3 | 0.8762966 | 0.8638376 | 0.8516137 | 0.8396193 |
| 4 | 0.8385613 | 0.8227025 | 0.8072167 | 0.7920937 |
| 5 | 0.8024510 | 0.7835262 | 0.7651344 | 0.7472582 |
REQUIRED:
- Using appropriate project appraisal techniques assess and demonstrate the financial viability of each project.
- Evaluate the methods of investment appraisal completed in part (a). Recommend the most appropriate project for the business.
LO3 Assessment Criteria 3.3
Distinction Task
To achieve a Distinction your written work must also evaluate the benefits of management accounting techniques in supporting financial decision making to ensure long term financial stability.
LO3 3D1
Task 5
The retail group has introduced a new product and uses a standard cost system. Standard costs for 1 000 kilograms of the new product are:
| Requirements | Quantity | Price per kilogram | Total Cost |
| Kilograms | £ | £ | |
| a | 1 600 | 0.50 | 800 |
| b | 400 | 0.80 | 320 |
| c | 400 | 0.20 | 80 |
| Input | 2 400 | 600 | |
| Output | 2 000 | 400 |
The production of 1 000 kilograms of the new product requires 1 200 kilograms of raw materials. Hence the yield is 1 000 / 1 200 or 5/6 of input. Materials records indicate.
| Materials | Opening Inventory | Purchases (units) in April | Closing Inventory |
| A | 20 000 kilograms | 324 000 @ £0.48 | 30 000 kilograms |
| B | 24 000 kilograms | 60 000 @ £0.84 | 8 000 kilograms |
| C | 30 000 kilograms | 64 000 @ £0.22 | 22 000 kilograms |
To convert 1 200 kilograms of raw materials into 1 000 kilograms of finished product required 25 hours of labour at £8.25 per hour. Actual direct labour hours and costs are 3,800 hours at £31,350. Factory overhead is applied on a direct labour hour basis at a rate of £9 per hour (£5 fixed, £4 variable).
Factory overhead is £36,000 with 4,000 direct labour hours. Actual overheads are £38,000, Actual finished production is 200,000 new products.
The standard cost per kilogram of the finished product:
| Materials | £0.60 per kilogram |
| Labour | £0.24 per kilogram |
| Factory overheads | £0.20 per kilogram |
The standard selling price per unit is a 25% markup on the total cost. The actual selling price is a 20% markup on the total cost.
REQUIRED:
- Calculate the total and unit costs of the finished product.
- Produce an absorption costing statement showing the marginal cost.
- Calculate the materials, labour and overhead variances.
- Interpret the variance results considering both financial and non-financial factors.
- Evaluate the use of different costing methods for pricing purposes