Evaluating the Important Metrics of Call Center Operations
Context Analysis
A hypothesis test can be used to determine whether a claim is verifiable or unverifiable to derive a conclusion about the hypothesized situation. Among the situations that can be hypothesized include business situations, where data is employed to confirm or disapprove the hypothesis before making strategic decisions. In the current analysis, an organization wants to evaluate the quality of its operations at the call center to determine whether the strategies adopted serve the intended purpose. The time in queue largely determines the quality of the service center since it determines the time a customer waits before being attended to by the available customer service representative. When customers wait for too long, they are likely to hang up or report an overall negative experience after the call. The analysis is conducted based on the existing literature that indicates that the average Time in Queue (TiQ) for the industry is 150 seconds.
Another important metric is Service Time (ST), which is the measure of the duration a customer service representative takes to serve the customer. Experienced and more knowledgeable customer service personnel resolve issues on calls faster (Allday, 2021). Among the ways to reduce the service time include offering training to customer service representatives or channeling calls to agents based on their areas of expertise. Since recent data has indicated that the average ST for the company is 210 seconds, the ST is above the industry average. Thus, the company has introduced a protocol that entails forwarding the calls to customer service representatives based on their expertise. Therefore, the current analysis aims to establish whether the New Protocol (PE) is effective compared to the Traditional Protocol (TP).
Hypothesis Test: Average TiQ
The following shows a hypothesis test to find out whether the average TiQ is lower than the industry standard of 2.5 minutes (150 seconds) at a significance level of α = 0.05.
Null Hypothesis (H0) = The average TiQ is equal to the industry standard of 2.5 minutes (150 seconds)
Alternative Hypothesis (HA) = The average TiQ is lower than the industry standard of 2.5 minutes (150 seconds)
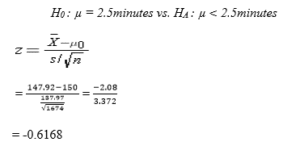
The calculated z-statistic score, which is also taken as the p-value is -0.6168, is less than the critical value obtained from the Z-table (1.645). Therefore, the null hypothesis that the average TiQ for the company is lower than the industry standard of 2.5 minutes is rejected (Field, 2018).
Evaluating Whether the Company Should Allocate More Resources To Improve Its Average TiQ
The analysis and the results from the hypothesis test can be used as the basis for determining whether the company should allocate more resources or not. The hypothesis test indicates that the company should invest more resources to lower the Time in Queue (TiQ) below the industry average.
Hypothesis Test: Average ST
The following shows a hypothesis test to find out whether the average ST with service protocol PE is lower than with the PT protocol using a significance level of α = 0.05.
Null Hypothesis (H0) = The average ST with service protocol PE is equal to PT protocol.
Alternative Hypothesis (HA) = The average ST with service protocol PE is less than with the PT protocol.
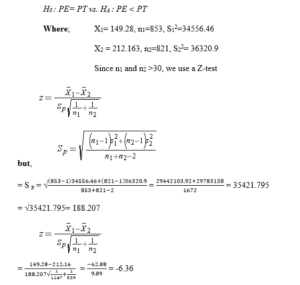
The calculated p-value is -6.36, which is less than the critical value from the table of 1.64. Therefore, the null hypothesis is rejected, and the conclusion is that the average ST with the new service protocol PE in the company is equal to the PT protocol.
An Assessment of Whether the New Protocol Served Its Purpose
The company introduced a new protocol to reduce the service time below the industry average. The analysis indicates that there is no difference in service time between the New Protocol (PE) and the Traditional Protocol (PT). This implies that the protocol did not serve the initial intended purpose. Therefore, the organization should re-strategize by employing other effective methods or offering more training to the customer service representatives.
Summary of Conclusions
In summary, the industry is performing better than the company in terms of service time as well as time in queue. According to Allday (2021), channeling calls based on the area of expertise is one of the ways to reduce service time. However, it did not work for the company. This may necessitate adopting a different strategy or advancing the currently employed strategies. For instance, the company can improve employee training, which will contribute to reduced service time and improved customer satisfaction. This would be the most effective way to reduce service time. To reduce the queue time, the company can increase the number of customer service representatives. Alternatively, the organization can also use Interactive Voice Response (IVR) systems to replace human beings for straightforward and non-complex matters such as commonly asked questions. In addition, the company can supplement the IVR system with a comprehensive customer-based website that provides answers to a wide range of questions, reducing the need for customers to talk with customer service representative agents. Therefore, the company can perform an evaluation of the new protocol to establish whether it will significantly reduce the Time in Queue (TiQ) or Service Time (ST) in the next few months before changing the strategies.
References
Allday, A. (2021). How to Reduce Call Handling Time in 4 Easy Steps. Alldaypa. Retrieved from https://www.alldaypa.co.uk/blog/how-to-reduce-call-handling-time/
Field, A. (2018). Discovering Statistics Using IBM SPSS Statistics. New York: Sage Publications.
ORDER A PLAGIARISM-FREE PAPER HERE
We’ll write everything from scratch
Question 
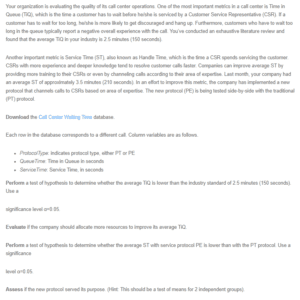
Your organization is evaluating the quality of its call center operations. One of the most important metrics in a call center is Time in Queue (TiQ), which is the time a customer has to wait before he/she is serviced by a Customer Service Representative (CSR). If a customer has to wait for too long, he/she is more likely to get discouraged and hang up. Furthermore, customers who have to wait too long in the queue typically report a negative overall experience with the call. You’ve conducted an exhaustive literature review and found that the average TiQ in your industry is 2.5 minutes (150 seconds).
Evaluating the Important Metrics of Call Center Operations
Another important metric is Service Time (ST), also known as Handle Time, which is the time a CSR spends servicing the customer. CSRs with more experience and deeper knowledge tend to resolve customer calls faster. Companies can improve average ST by providing more training to their CSRs or even by channeling calls according to their area of expertise. Last month, your company had an average ST of approximately 3.5 minutes (210 seconds). In an effort to improve this metric, the company has implemented a new protocol that channels calls to CSRs based on area of expertise. The new protocol (PE) is being tested side-by-side with the traditional (PT) protocol.
Download the Call Center Waiting Time database.
Each row in the database corresponds to a different call. Column variables are as follows.
- ProtocolType: indicates protocol type, either PT or PE
- QueueTime: Time in Queue in seconds
- ServiceTime: Service Time, in seconds
Perform a test of hypothesis to determine whether the average TiQ is lower than the industry standard of 2.5 minutes (150 seconds). Use a
significance level α=0.05.
Evaluate if the company should allocate more resources to improve its average TiQ.
Perform a test of hypothesis to determine whether the average ST with service protocol PE is lower than with the PT protocol. Use a significance
level α=0.05.
Assess if the new protocol served its purpose. (Hint: This should be a test of means for 2 independent groups).
Write a 175-word summary of your conclusions.