Ethical Behavior of Business Students
Data Analysis Part
Count of Cheated Column Labels Row Labels No Yes Grand Total Bus132033 Non-Bus141327 Grand Total 273360
| 1. Pivot Table
Count of Cheated Row Labels No |
Column Labels
Yes |
Grand Total | |
| Ath | 6 | 11 | 17 |
| Non_Ath | 1 | 1 | |
| Non-Ath | 7 | 8 | 15 |
| Ath | 9 | 9 | 18 |
| Non-Ath | 5 | 4 | 9 |
| Nationwide Average | % Cheated |
| Business | 56% |
| Nonbusiness | 47% |
| 2. Bar Chart | |
| Bar chart starts in this cell – F20
|
| 3-6 Hypothesis Test | |||||||||||
| Business Nonathlete vs. National Average | Business Athlete vs. National Average | Business vs. National Average | Nonbusiness vs. National Average | ||||||||
| Proportion | Proportion | Proportion | Proportion | ||||||||
| Sample Size (n) =count(range) |
16 | Sample Size (n) =count(range) |
17 | Sample Size (n) =count(range) |
33 | Sample Size (n) =count(range) |
27 | ||||
| Response of Interest (ROI) | 9 | Response of Interest (ROI) | 11 | Response of Interest (ROI) | 20 | Response of Interest (ROI) | 13 | ||||
| Count for Response (CFR) =COUNTIF(range,ROI) |
Count for Response (CFR) =COUNTIF(range,ROI) |
#NAME? | Count for Response (CFR) =COUNTIF(range,ROI) |
#NAME? | Count for Response (CFR) =COUNTIF(range,ROI) |
#NAME? | |||||
| Sample Proportion (pbar) =CFR/n |
Sample Proportion (pbar) =CFR/n |
#NAME? | Sample Proportion (pbar) =CFR/n |
#NAME? | Sample Proportion (pbar) =CFR/n |
#NAME? | |||||
| Highlight your H0 and Ha | Two Tail H0: p = po Ha: p ≠ po Left Tail H0: p ≥ po Ha: p < po Right Tail H0: p ≤ po Ha: p > po |
Highlight your H0 and Ha | Two Tail H0: p = po Ha: p ≠ po Left Tail H0: p ≥ po Ha: p < po Right Tail H0: p ≤ po Ha: p > po |
Highlight your H0 and Ha | Two Tail H0: p = po Ha: p ≠ po Left Tail H0: p ≥ po Ha: p < po Right Tail H0: p ≤ po Ha: p > po |
Highlight your H0 and Ha | Two Tail H0: p = po Ha: p ≠ po Left Tail H0: p ≥ po Ha: p < po Right Tail H0: p ≤ po Ha: p > po |
||||
| Hypothesized | 0.56 | Hypothesized | 0.56 | Hypothesized | 0.56 | Hypothesized | 0.47 | ||||
| Confidence Coefficient (Coe) | 0.95 | Confidence Coefficient (Coe) | 0.95 | Confidence Coefficient (Coe) | 0.95 | Confidence Coefficient (Coe) | 0.95 | ||||
| Level of Significance (alpha) =1-Coe |
0.05 | Level of Significance (alpha) =1-Coe |
0.05 | Level of Significance (alpha) =1-Coe |
0.05 | Level of Significance (alpha) =1-Coe |
0.05 | ||||
| Standard Error (StdError) =SQRT(Hypo*(1-Hypo)/n) |
0.1241 | Standard Error (StdError) =SQRT(Hypo*(1-Hypo)/n) |
0.1204 | Standard Error (StdError) =SQRT(Hypo*(1-Hypo)/n) |
0.0864 | Standard Error (StdError) =SQRT(Hypo*(1-Hypo)/n) |
0.0961 | ||||
| Test Statistic (Z-stat) =(pbar-Hypo)/StdError |
-4.5126 | Test Statistic (Z-stat) =(pbar-Hypo)/StdError |
#NAME? | Test Statistic (Z-stat) =(pbar-Hypo)/StdError |
#NAME? | Test Statistic (Z-stat) =(pbar-Hypo)/StdError |
#NAME? | ||||
| Accept or Reject: Left Tail | Reject | Accept or Reject: Left Tail | #NAME? | Accept or Reject: Left Tail | #NAME? | Accept or Reject: Left Tail | #NAME? | ||||
| Accept or Reject: Right Tail | Do not reject | Accept or Reject: Right Tail | #NAME? | Accept or Reject: Right Tail | #NAME? | Accept or Reject: Right Tail | #NAME? | ||||
| Accept or Reject: Two Tail | Reject | Accept or Reject: Two Tail | #NAME? | Accept or Reject: Two Tail | #NAME? | Accept or Reject: Two Tail | #NAME? | ||||
| p-value (Lower Tail) =NORM.S.DIST(z,TRUE) |
0.0000 | p-value (Lower Tail) =NORM.S.DIST(z,TRUE) |
#NAME? | p-value (Lower Tail) =NORM.S.DIST(z,TRUE) |
#NAME? | p-value (Lower Tail) =NORM.S.DIST(z,TRUE) |
#NAME? | ||||
| p-value (Upper Tail) =1-LowerTail |
1.0000 | p-value (Upper Tail) =1-LowerTail |
#NAME? | p-value (Upper Tail) =1-LowerTail |
#NAME? | p-value (Upper Tail) =1-LowerTail |
#NAME? | ||||
| p-value (Two Tail) =2*MIN(LowerTail,UpperTail) |
0.0000 | p-value (Two Tail) =2*MIN(LowerTail,UpperTail) |
#NAME? | p-value (Two Tail) =2*MIN(LowerTail,UpperTail) |
#NAME? | p-value (Two Tail) =2*MIN(LowerTail,UpperTail) |
#NAME? | ||||
| Accept or Reject p-value: Left Tail | Reject | Accept or Reject p-value: Left Tail | #NAME? | Accept or Reject p-value: Left Tail | #NAME? | Accept or Reject p-value: Left Tail | #NAME? | ||||
| Accept or Reject p-value: Right Tail | Do not reject | Accept or Reject p-value: Right Tail | #NAME? | Accept or Reject p-value: Right Tail | #NAME? | Accept or Reject p-value: Right Tail | #NAME? | ||||
| Accept or Reject p-value: Two Tail | Reject | Accept or Reject p-value: Two Tail | #NAME? | Accept or Reject p-value: Two Tail | #NAME? | Accept or Reject p-value: Two Tail | #NAME? | ||||
| p-Lower Limit =pbar-CONFIDENCE.NORM(alpha,StdError,n) |
-0.0608 | p-Lower Limit =pbar-CONFIDENCE.NORM(alpha,StdError,n) |
#NAME? | p-Lower Limit =pbar-CONFIDENCE.NORM(alpha,StdError,n) |
#NAME? | p-Lower Limit =pbar-CONFIDENCE.NORM(alpha,StdError,n) |
#NAME? | ||||
| p-Upper Limit =pbar+CONFIDENCE.NORM(alpha,StdError,n) |
0.0608 | p-Upper Limit =pbar+CONFIDENCE.NORM(alpha,StdError,n) |
#NAME? | p-Upper Limit =pbar+CONFIDENCE.NORM(alpha,StdError,n) |
#NAME? | p-Upper Limit =pbar+CONFIDENCE.NORM(alpha,StdError,n) |
#NAME? | ||||
| Statistical Difference | |||||||||||
| z-score | > or < alpha (0.05) | Statistical significance (difference) | Reject/Accpt the H0 | ||
| Non-athlete BDT business students and the national average for business students | -4.5126 | < 0.05 | yes | Accept | |
| Athlete BDT business students and the national average for business students | Undefined | # | Null | Reject | |
| Between BDT business students and the national average for business students | Undefined | # | Null | Reject | |
Written Report Part
Introduction (Define): Explain, in your own words, why you are providing this report and the problem(s) you are trying to solve.
In the past, the business world has witnessed the collapse of major corporations due to financial crises. The 2007-2009 economic recession is considered the most significant economic downturn. The crisis has since affected the public confidence in rust corporations. One of the most underlying and largely assumed factors that sowed the seeds of recession is academic dishonesty among corporate executives, financial managers, and other corporate officers. Extant studies revealed that there were many cases of academic cheating during their academic careers. Meanwhile, academic cheating and dishonesty among business students make them ill-equipped for the real corporate world. This state of affairs forced Bo Diddley Tech (BDT) to research the same unethical conduct among its business students. This report summarizes the study’s findings and reports that participating in athletics does not influence cheating practice among students. The findings in this report will help the dean in crafting innovative interventions to stop the unethical culture.
Need help with your assignment ? Reach out to us.
Collect: Describe the data set you used.
The statistical analysis sought to assess the plausibility of the current ethical behaviors of business students in Bo Diddley Tech (BDT) institution. The analysis borrowed the 20-sampled student population data from the Chronicle of Higher Education in undertaking this analysis. A pivot table was used in extracting a sample of 60 responses from the extensive and detailed national data set, as reported in the Chronicle of Higher Education. The data consisted of students undertaking their college education. This stratum was further divided to include various categories of students, namely Business Students and Non-Business Students. The earlier category was subdivided to include Athletic students and Non-Athletic students. The table is shown in the attached Excel sheet.
Organization: Description of the Pivot Table
The extrapolated data were summarized in the pivot table as displayed in the Excel sheet. The table consists of only columns and rows, with rows having Business Student and Athlete entries while columns having survey responses, those who cheated, and those who never cheated in their academic careers. A total of 33 business students were captured in the table. Of all these, 11 athletic students admitted to having cheated, while the remaining 11 did not commit academic dishonesty. In the same vein, of the 33 business students, a total of 9 Non-athletic students did cheat at some point in their academic careers. The remaining 27 samples comprised of Non-Business Students. Out of this population, both the athletic students who cheated and those who never cheated were 9. In the same category, 5 non-athletic students never cheated while the remaining 4 committed dishonesty.
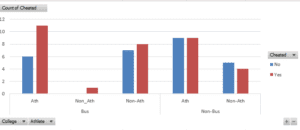
Visualization: Description of Bar Chart
The bar chart gives information about how many students who were either business students (athletic or non-athletic) or non-business students (athletic or non-athletic) cheated in their academic careers. According to the chart, there were cases of academic impropriety for both business and non-business students. Non-athletic business students took a fair share of the academic cheating practice by 17, with the remaining 16 shunning the practice. In terms of non-business students, a total of 9 athletic students did not participate in academic dishonesty, as did the remaining 9. 4 non-athletic students committed irregularity, and the remaining 5 did not cheat in their academic work.
Analyze: Provide a summary of your conclusions based on the four population proportion hypothesis tests.
As reported in the data, participating in athletics does not have a moderating effect on exam malpractice among business and non-business students. Contrary to the belief of BDT’s dean that the spirit of fair play in sporting activities makes students less likely to cheat in their examinations, athlete students cheated even more than their non-athlete counterparts. In the business student category, athletic members are by far the leaders in academic dishonesty. Notably, out of 17 of them, only 6 did not report cheating. Similarly, out of 17 non-athlete business students, 9 cheated while 7 did not. However, in the non-business category, out of 18 athlete learners, 9 cheated, while 9 did not report the malpractice. In the same breath, out of 9 non-athletic students cheating the remaining 5 not reporting the practice.
Ethical Summary: The dean has expressed a concern related to the amount of cheating currently taking place at BDT and has strongly suggested that you “tweak” the statistical data such that they favor the image of the university. Discuss the potential use of unethical manipulation of statistical data to provide a biased outcome as well as the ethical counter proposal you would offer the dean in this scenario.
Data interpretation and reporting can be based on unethical manipulation to minimize any form of bias. In one way, data can be misinterpreted, either through evert fraudulent or mere inflation of statistical data, which may, in turn, negatively affect BDT institutions. This irregularity may stem from failing to include the number of eligible participants, inaccurate reporting of mission data, or failing to report all potential data (Saunders et al., 2019). However, from an ethical standpoint, research studies usually pursue meaningful academic inquiry, implying that unethical manipulation of data carries both short-term and long-term ramifications. For this reason, honesty and authenticity are crucial in preserving an institution’s integrity, not to mention that of the overall scientific enterprise.
Conclusion: What advice would you give to the dean based upon your analysis of the data?
Therefore, on the dean’s request to tweak data to remove bias, I would advise him that potential disappointments should not overshadow the pursuit of truth and knowledge derived from significant and accurate scientific findings
References
Saunders, M., Lewis, P., & Thornhill, A. (2019). Research methods for business students (6th ed.). Pearson Education Limited.
ORDER A PLAGIARISM-FREE PAPER HERE
We’ll write everything from scratch
Question 
Ethical Behavior of Business Students
During the global recession of 2008 and 2009, there were many accusations of unethical behavior by Wall Street executives, financial managers, and other corporate officers. At that time, an article appeared that suggested that part of the reason for such unethical business behavior may have stemmed from the fact that cheating had become more prevalent among business students, according to a February 10, 2009, article in the Chronicle of Higher Education. The article reported that 56% of business students admitted to cheating at some time during their academic career as compared to 47% of nonbusiness students.
Ethical Behavior of Business Students
Cheating has been a concern of the dean of the college of business at Bo Diddley Tech (BDT) for several years. Some faculty members in the college believe that cheating is more widespread at BDT than at other universities, whereas other faculty members think that cheating is not a major problem in the college. To resolve some of these issues, the dean commissioned a study to assess the current ethical behavior of business students at BDT. As a former college athlete herself, the dean believed that the spirit of fair play students develop as part of participating in athletics would make them less likely to cheat. As part of this study, an anonymous exit survey was administered to a sample of 240 students from this year’s graduating class, half of whom were business students and half of whom were not. The survey asked various questions, including the student’s college and if the student was an athlete or not. Responses of the various questions were fed into a computer algorithm that made a quantitative determination as to whether the student should be considered a “cheater” or not. The results are in the attached Excel spreadsheet, “Benchmark – Bo Diddley Tech Data Set.”
Prepare a managerial report as part of your submission to the dean of the college that summarizes your assessment of the nature of cheating at BDT. Be sure to include the following items in your written report.
Instructions: Data Analysis Part
Utilize the data set provided by the instructor in the Excel spreadsheet, “Benchmark – Bo Diddley Tech Data Set” (60 records per student).
Submit the Excel data calculations (Alpha 0.05).
- Make a pivot table with: Business Student (Rows), Athlete (Rows), Cheated (Columns), and Cheated (Summed Value).
- Create a bar chart showing cheating by athletes and business students.
- Determine if there is a statistical difference between nonathlete BDT business students and the national average for business students as reported by the Chronicle of Higher Education.
- Determine if there is a statistical difference between athlete BDT business students and the national average for business students as reported by the Chronicle of Higher Education.
- Determine if there is a statistical difference between BDT business students and the national average for business students as reported by the Chronicle of Higher Education.
- Determine if there is a statistical difference between BDT nonbusiness students and the national average for nonbusiness students as reported by the Chronicle of Higher Education.
Instructions: Written Report Part:
Utilizing the data you have analyzed, write a managerial report of 500-800 words for the dean. The managerial report needs to include an introduction, analysis, conclusion, and a minimum of three supporting references.
- Introduction (Define): Explain, in your own words, why you are providing this report and the problem(s) you are trying to solve.
- Collect: Describe the data set you used.
- Organize: Describe your pivot table.
- Visualize: Include and describe your bar chart.
- Analyze: Provide a summary of your conclusions based on the four population proportion hypothesis tests.
- Ethical Summary: The dean has expressed a concern related to the amount of cheating currently taking place at BDT and has strongly suggested that you “tweak” the statistical data such that they favor the image of the university. Discuss the potential use of unethical manipulation of statistical data to provide a biased outcome as well as the ethical counter proposal you would offer the dean in this scenario.
- Conclusion: What advice would you give to the dean based upon your analysis of the data?
You are required to submit your Excel data analysis along with your written report.
Prepare this assignment according to the guidelines found in the APA Style Guide, located in the Student Success Center. An abstract is not required.
This assignment uses a rubric. Please review the rubric prior to beginning the assignment to become familiar with the expectations for successful completion.
You are required to submit this assignment to LopesWrite. Refer to the LopesWrite Technical Support articles for assistance.
Benchmark Information
This benchmark assignment assesses the following programmatic competencies:
- BS Business Information Systems,
- 2.2 Use quantitative techniques and tools to analyze data relevant to business decision making. [MC3]
- BS Business Administration, BS Business Information Systems, BS Accounting, BS Business Analytics, BS Business Management, BS Entrepreneurial Studies, BS Finance, BS Finance and Economics, BS Hospitality Management, BS Sports Management, BS Supply Chain and Logistics Management
- 2.3: Use quantitative techniques and tools to analyze data relevant to business decision making. [MC3]
- BS Business for Secondary Education
- 7.3: Use appropriate computer applications to perform mathematical calculations relevant to solving business problems.