Business Research
There are three basic features that should be incorporated in a theoretical framework:
A theoretical framework acts as a study’s guide. A researcher takes or borrows a theory from other sources, such as studies, and uses the theory to set up their research. A theoretical framework is to study what a travel plan is to a traveler. Thus, it ensures that the researcher does not deviate from the established theories in an effort to make a scholarly contribution. The role of the theoretical framework is to provide a reliable structure that enables the proper definition of a study. These definitions further facilitate the selection of the study design as well as data analysis methods. All aspects of a study, including the literature review, problem statement, methodology, discussion, and analysis, should resonate with the chosen framework (Adom & Hussein, 2018). The main elements of a theoretical framework include variables, diagrams, and theory.
Provide a brief discussion of these features.
A theory is a generalization regarding certain observations. It incorporates various models and ideas. The theories are critical to studies as they provide explanations, predictions, and a phenomenon. When choosing a theory, it is important to consider the study’s discipline and field. Once certain theories have been selected, they should be assessed to determine suitability.
A variable can be dependent or independent. To successfully operationalize these variables, one must define each first and then choose the most suitable means of construction. Construction occurs through the connection of concepts to certain observations. Selecting a measurement (nominal, ordinal, interval, and ratio) is important. When one measures a construct, it becomes a variable. The dependent variables are affected by the independent variables. Variables can also be mediating/intervening or moderating (Tariq, 2015).
Diagrams are used in theoretical frameworks to enhance understanding. The diagrams indicate the dependent and independent variables. Such representation allows a researcher to communicate the chosen theory and constructed variables in an easy and comprehensive manner. Readers and other study beneficiaries can grasp the theoretical framework by simply looking at the diagram provided in the study.
Assess the quality of the theoretical framework developed in the report. Please include the three basic features in your discussion.
Jupiter Electric’s study’s theoretical framework is relatively well developed. The researchers include a discussion of the main theory/model, SOCO (Selling Orientation-Customer Orientation). The study explains SOCO as a model that determines the effect of salespeople and retailers on customer satisfaction. The SOCO scale is comprised of twenty-four items and was developed in 1982 by Weitz and Saxe. It was intended to measure salespeople’s self-assessment of customer orientation. The twenty-four items spell out different methods of interaction between customers and salespeople (Thomas et al., 2001). The provision of this explanation brings the reader into the study’s chosen theory and facilitates understanding.
Secondly, the authors provide a diagram that spells out the various elements of the entire theoretical framework. Figure 1 in the study highlights four aspects, which include variables. The dependent variable includes customer satisfaction; the independent variable includes customer orientation. Thus, as regards highlighting the three basic aspects of a theoretical framework, the report’s authors have successfully met the requirement.
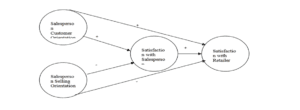
Figure 1
Characteristics of cause-and-effect relationships
First, control variables are the elements that scholars keep constant during a study. Controlling the extraneous and confounding variables requires accurate measures that indicate the relationship between an independent and dependent variable. Failure to control the confounding variables can lead to skewed results. Thus, control variables are critical in obtaining accurate measures.
These extraneous variables need to be controlled due to their ability to lessen the effects of the independent on the dependent variable. The confounding variables tend to vary with the independent factors, leading to different effects in varying groups. They prevent proper determination of the cause of effects. One can control these variables using randomization and elimination. Through random distribution, researchers can avoid accidental bias. This method ensures that subjects are similar and lack any systematic variations, which can vary the results. Randomization can be simple, block, stratified, or covariate-adaptive (Suresh, 2011). Elimination is a different method of control that involves the complete removal of the identified extraneous variables. The variables can also be balanced through equal distribution among all subjects or groups (Street, 1995). Based on this exploration, the case study’s authors have not practiced any variable control due to their possible absence. The study does not mention any extraneous or confounding variables that needed controlling. Instead, the main variables are measured using Cronbach’s alphas, while the 5-Point Likert Scale measures the main items.
Sampling
Sampling allows researchers to select members of the population to make up the desired sample. Through sampling, the study gains accuracy and is economical. There are various methods of sampling. Probability sampling presents an equal chance of selection. This ensures that the sample adequately represents the population. Various methods of probability sampling include simple random, stratified, systematic, cluster, and multi-stage systematic methods. Non-probability sampling methods rely on nonrandom methods of sample selection. The method, which uses judgment, remains useful for specific cases. However, it is impossible to generalize when using this method. The methods include convenience, snowballing, purposive, and quota sampling (Taherdoost, 2016).
A study that has researchers ask people who leave the shop with plastic bags to fill out the questionnaires is an example of a non-probability sampling method. The case study uses convenience sampling, which is categorized under the nonprobability sampling method. The method of sampling is beneficial to the study, which has multiple variables. For multivariate studies, the sample should be at least ten times the variables. This implies that the study could only have a minimum of 40 subjects. Using this method provided a large number from which the researchers had to select to achieve the minimum threshold. Two hundred fifty-three (253) clients met the initial sampling requirement. Only 50 agreed to take part in the study. Thus, the method was ideal and appropriate for the study.
Cronbach’s Alpha
Cronbach’s alpha provides a test’s internal consistency measure. Its measure falls within 0 to l1. Internal consistency is the extent of equal measure for all items in a test. This should be determined before applying the test in a study. When a test’s items are correlated, alpha’s value increases. This high value does not imply a high degree of internal consistency. The period of the test also affects the result (Tavakol & Dennick, 2011).
In the case study, all variables’ alpha measures are above .7. The first independent variable, the customer orientation of a salesperson, has a .7798 score. The selling orientation of the salesperson’s independent variable’s score is .8759. The satisfaction with the salesperson mediating variable’s score is .8988. The satisfaction with retailer dependent variable’s score is .8530. The mediating variable has the highest score, while the first independent variable has the lowest score. The example items that the researchers provide for each variable facilitate the measurement of the alpha score. All the scores are within the acceptance range of 0 to 1. They also show a reliably high level of internal consistency among the items, validating the test’s use in the study.
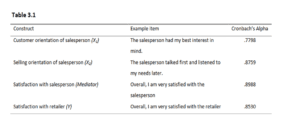
Table 3.1
Regression analysis
Regression analysis allows researchers to measure the relationship between the dependent and independent variables. The benefits of using this method include determining if an actual relationship exists among variables and their strength and enabling the researcher to make reliable predictions. The requirements for successful regression analysis include a sample, variables, scales of the dependent variable, and collinearity.
The case study revealed that all variables were strongly correlated. The selling and customer orientation had a negative correlation. Selling orientation was negatively correlated to the mediating and dependent variables. Customer orientation was positively correlated to other variables. Another positive correlation was identified between the satisfaction with the salesperson and the retailer.
These tests are directly related to the questionnaire through the pre-formulated hypothesis. The support that was identified for hypotheses 1, 2, 4, and 5 provided the researchers with valuable information that led to the conclusion. These tests were important for finding the facts among the respondents’ information in the questionnaires. The researchers’ ability to numerically measure the information creates space for the validity and reliability of the results.
Recommendations
The chosen method of data collection that the researchers used is questionnaires. However, this data seemed insufficient to test all four already formulated hypotheses. The lack of support for the third hypothesis highlights an aspect of insufficient data. Studies can use multiple methods of data collection to avoid missing information that would be expressed differently. The mixed-method studies are well-established and conducted for certain reasons. For instance, in this case study, the researchers would have used interviews alongside questionnaires to find further information that respondents could not fill in the documents. This additional information would have been useful in testing all hypotheses sufficiently. The other strategy is using open-ended questions that allow respondents to provide additional information. This maximizes the efficiency of the questionnaires as a data collection tool. The sole use of closed questions tends to undermine the process. Mixing the two types of questions can also be extremely beneficial for such studies in the future.
Finally, the researchers should use probability sampling that provides an equal chance to all potential subjects and creates a representative sample. Non-probability sampling methods are ideal for special case studies that deal with a unique population. In this case, shoppers at Jupiter Electric do not require special characteristics to participate in the study. Random sampling techniques are highly recommended for such studies as they eliminate any possible bias and increase the results’ generalizability, validity, and reliability. The researchers should have used random methods to select study participants. A large number of potential participants provides researchers with a chance to retain a reliable sample.
References
Adom , D., & Hussein, E. K. (2018). Theoretical and Conceptual Framework: Mandatory Ingredients of a Quality Research. International Journal of Scientific Research, 7(1), 438-441.
Street, D. L. (1995). Controlling extraneous variables in experimental research: a research note. Accounting Education, 4(2), 169-188.
Suresh, K. P. (2011). An overview of randomization techniques: An unbiased assessment of outcome in clinical research. Journal of Human Reproductive Sciences, 4(1), 8-11.
Taherdoost, H. (2016). Sampling Methods in Research Methodology; How to Choose a Sampling Tech-nique for Research. International Journal of Academic Research in Management, 5(2), 18-27.
Tariq, M. U. (2015). Operationalizing Variables in Theoretical Frameworks: A Comparative Analysis. Durresamin Journal, 1, 1-11.
Tavakol, M., & Dennick, R. (2011). Making sense of Cronbach’s alpha. International Journal of Medical Education, 2, 53-55.
Thomas, R. W., Soutar, G. N., & Ryan, M. M. (2001). The Selling Orientation-Customer Orientation (S.O.C.O.) Scale: A Proposed Short Form. The Journal of Personal Selling and Sales Management, 21(1), 63-69.
ORDER A PLAGIARISM-FREE PAPER HERE
We’ll write everything from scratch
Question 
Business Research Methodology
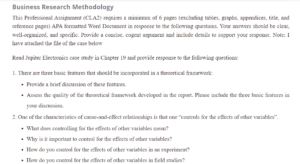
This Professional Assignment (CLA2) requires a minimum of 6 pages (excluding tables, graphs, appendices, title, and reference pages) APA formatted Word Document in response to the following questions. Your answers should be clear, well-organized, and specific. Provide a concise, cogent argument and include details to support your response. Note; I have attached the file of the case below
Business Research
Read Jupiter Electronics case study in Chapter 19 and provide response to the following questions:
- There are three basic features that should be incorporated in a theoretical framework:
- Provide a brief discussion of these features.
- Assess the quality of the theoretical framework developed in the report. Please include the three basic features in your discussion.
- One of the characteristics of cause-and-effect relationships is that one “controls for the effects of other variables”.
- What does controlling for the effects of other variables mean?
- Why is it important to control for the effects of other variables?
- How do you control for the effects of other variables in an experiment?
- How do you control for the effects of other variables in field studies?
- Do the researchers in this case study mentioned above control for the effects of other variables?
- The researchers ask the people who leave the shop with a plastic bag of the shop to fill out a questionnaire.
- Is this an example of probability or non-probability sampling?
- How do you feel about the sampling method that has been employed in this study?
- Table 3.1 in Jupiter Electronics case study in chapter 19 provides an overview of the outcome of Cronbach’s alpha’s assessment in the study.
- What is the purpose of calculating Cronbach’s alpha?
- Discuss the Cronbach’s alpha outcomes in Table 3.1.
- The researchers test their hypotheses using regression analysis. How are statistical tests related to the questionnaire that has been used in the case mentioned in chapter 19?
- The researchers in the case mentioned in above questions (5) indicate a few weak points of their study. Provide and discuss at least two additional weak points of the study. Provide recommendations for improvement