Business Analytics- Identifying Trends in US Airline Industry and Alaska Airline Airlines Company
Introduction
The business analytics report focuses on identifying the trends in the number of passengers, flights, and net income for air transport for the last 20 months in the domestic US airline industry and Alaska Airlines. The income is divided into quarters. The airline industry is relevant for the current analysis since both domestic and international airline companies were largely affected by the ongoing global pandemic. Therefore, the main purpose of the research is to identify the trends in the industry and compare the industry trends with Alaska Airlines company to establish whether the company matches the industry dynamics. This can be used to make strategic decisions to ensure that the company performs better than the overall industry.
Hire our assignment writing services in case your assignment is devastating you.
Objectives; Study Deliverables
Identify the trends in the number of passengers and flights for the US airline industry and Alaska Airlines Company
Identify the income trends for the US airline industry and Alaska Airlines Company
Comparing the trends in Passengers, Flight, and Income trends between the US Airline industry and Alaska Airlines Company and establishing the correlation between the variables.
2.0. Data
The analytics report uses data freely available from the Bureau of Transportation Statistics (TranStats, 2021). The time-series data contains data on passengers, flights, revenue passenger miles, available set miles, load factor, net income, and operating revenue. The website contains data for both domestic and international travel. The current study uses figures for domestic travel since most airlines and carriers have withheld their data for international travel for the last three months for confidentiality purposes on individual routes. The website contains time series data for the factors analyzed since 2000. However, the analysis considers data trends in the last 20 months for the purposes of currency. Also, due to the pandemic effects, recent business data trends have become an interesting endeavor. In any field, it is crucial for a company to know its operational success and effectiveness in relation to the overall industry dynamics.
The sampled data contains observations for the last 20 months to ensure that the data points are sufficient and cover a considerably longer period to derive concrete inferences from the trends. The time frame from when the data is derived is between January 2020 to August 2021. For income, the quarterly data used covers between January 2020 and the second quarter of 2021, ending June (TranStats, 2021). The three variables analyzed are the number of passengers, flights, and net income. Domestic data is used for the number of passengers and flights. On the other hand, the net income values represent income figures for both international and domestic flights in thousand dollars. The data relates to the research and closely meets each of the outlined objectives. To ensure that the data used closely relates to the research and strictly meets the study objectives, only the data covering the targeted time frames and containing the target variables was extracted from the website.
3.0. Analysis
In the airline industry, like any other industry in the business field, business analytics methodology is an imperative approach to studying market trends and evaluating the performance of the business for strategizing purposes. Basically, business analytics entails the collection, evaluation, and drawing of useful insights from a huge volume of data from the target business aspects. Several companies are employing the analytics methodology in the modern data-driven business environment to enhance informed decisions (Andreoni & Postorino, 2016). The findings from such data can be leveraged to address the prevailing challenges while improving the operational processes in a company or industry. Although the current study does not employ huge data, the data set can be used to draw useful inferences about the company in relation to the industry. Every business is focusing on analytics to change how decisions are made. Besides, organizations are collecting huge volumes of data in a bid to record all the operations for modeling and projections (Andreoni & Postorino, 2016). The various optimization and modeling techniques enable businesses to draw useful findings from big data.
The current analytics report focuses on three key objectives. Recently, the airline industry has witnessed deviations in performance due to the Covid-19 pandemic. The measures to combat the spread of the disease heavily impacted the business world. The current quantitative analysis using graphs and tables provides a visual basis for comparing the two entities. The data used sufficiently meets the research objectives and provides a basis for conclusions about the relationship between Alaska Company trends and the industry trends.
Comparing the Trend in the Number of Passengers in the US Airline Industry and Alaska Airlines
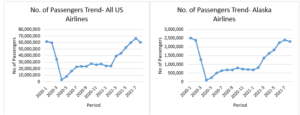
Figure 1: Comparing the Trend in the Number of Passengers for the US Airline industry and Alaska Airlines Company
The data projecting the change in the number of passengers in the US airline industry and Alaska Airlines covers the period when the business field has experienced one of the challenging periods. The airline industry, particularly domestic travels were greatly hindered. The measures to mitigate the spread of the disease saw governments in various regions impose restrictions such as partial or total lockdowns. This meant that passengers could not travel beyond national borders. The data analytics indicate that various businesses experienced historical declines in the number of customers and subsequently low incomes. The number of passengers declined abruptly and sharply during the covered period.
To contextualize the decline, the US airline industry experienced a 95.3% decline in the number of domestic passengers between January 2020 and April 2020. Similarly, Alaska Airlines company experienced a 96.2% decline in the number of passengers during the same period. This implies that Alaska company experienced a larger marginal decrease in the number of passengers compared to the industrial decline. During this period, the Covid-19 pandemic was at the peak of its spread, causing high deaths in the US and other parts of the country. This caused worries and fear of traveling among people. Besides the restrictions by the US government, people experienced job losses that reduced the amount of disposable income, hindering people from traveling. Between January 2021 and July 2021, the company experienced a 71.9% increase in the number of passengers, which was the largest increase over the studied time frame. The industry experienced the highest increase in the number of passengers by 63.2% between February 2021 and July 2021.
Comparing the Trend in the Number of Flights between the US Airline Industry and Alaska Airline Company
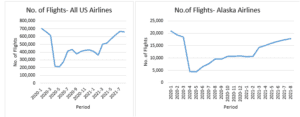
Figure 2: Comparing the Trend in the Number of Flights between the US Airline Industry and Alaska Airlines Company
Directly, the evident reduction in the number of passengers subsequently led to a decrease in the number of domestic flights for both the industry and the company over the period. Looking at the shape of the graphs, the trend in the number of passengers reflects the change in the number of flights. The US airline industry experienced a 68.9% decline in the number of domestic flights within the US between January 2020 and April 2020. Likewise, Alaska Airlines company experienced a 78.2% decline in the number of domestic flights for the same period. This shows that Alaska company experienced a larger deviation in the number of flights compared to the industrial deviation. This is attributable to adherence to the Covid-19 guidelines hindering normal travel.
International travels were also hindered further through the declaration of some places as red zones. The largest increase in the number of flights in the industry 45.7% was between February 2021 and July 2021. The company recorded a 58.9% increase in flights between May 2020 and February 2021. The company had a higher recovery rate compared to the industry. The recent discovery of the vaccine has improved the situation and allowed more flights within and outside the country. Although the industry’s flight curve flattened towards August 2018, recent data has shown an upward trend in the number of flights. The number of flights is even projected to increase further towards 2022 and over the festive season and with the resumption of physical learning.
Comparing the Net Income Trends for the Whole Airline Industry and Alaska Airlines Company
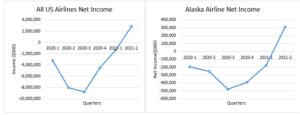
Figure 3: Comparison between the Net Income Trends for the Whole Airline Industry and Alaska Airlines Company
The income data portrays the quarterly trend in the net income accrued from the business. The decrease in the level of income is evidence of a struggling industry and company. The industry and the company recorded negative net income, which implied that the companies operated at a loss. The industry experienced the largest negative net income in the third quarter of 2020 covering the months of July, August, and September. Similarly, the company also experienced the largest negative net income during the same period. The US recorded the highest number of deaths due to the pandemic during this period. The industry experienced a higher recovery rate compared to the industry from the third quarter of 2020 to the second quarter of 2021. The industry projects higher income towards 2022 before full stabilization.
Correlation Analysis for the Number of Passengers and Fights in the US Airline Industry and Alaska Airline Company
| Passengers-All US Airlines | Flights-All US Airlines | Passengers- Alaska Airlines | Flights-Alaska Airlines | |
| Passengers ( All US) | 1 | |||
| Flights (All US) | 0.951112 | 1 | ||
| Passengers (Alaska) | 0.989143 | 0.940544 | 1 | |
| Flights(Alaska) | 0.927774 | 0.974217 | 0.932395887 | 1 |
Table 1: The Correlation between Passengers and Flights for the Industry and Alaska Airlines
The correlation analysis indicates the relationship between the number of passengers and flights in the industry and the number of passengers and flights recorded by Alaska Airlines to establish whether there is a correlation. The correlation values obtained indicate that the variables studied are highly positively correlated. Ideally, the number of passengers and flights at the companies’ level determines the number of passengers and flights at the industry level. The correlation values are close to 1, indicating a strong positive correlation. Besides, income level is also positively correlated to the number of passengers and flights at both the company and industry levels. This implies for the company that solving the challenge of low income should start by solving the causative factors.
4.0. Conclusion
Generally, business analytics has proven phenomenal in deriving useful business insights for the company and the industry for informed decisions. The study of the trends indicates that the air transport industry was largely affected by the Covid-19 pandemic. The trends confirm the strong positive relationship that exists between the three variables under study. The company portrays a higher rate of recovery in the number of flights compared to the industry. However, the industry has a higher recovery rate on net income compared to the company. The company can improve its services and conduct an aggressive promotional campaign to attract more passengers to increase revenue over the festive season. For more informed decisions, the company can also conduct further analytics using other variables and establish other relationships affecting business success. For instance, the company can conduct analytics on the demand for air tickets based on the seasons to determine the seasons with a high number of passengers. The company can also test different business models to determine the model that yields the best returns by using the elements in the model to conduct in-depth analytics. In the airline industry, it is crucial to establish the company’s competitive position in relation to other key competitors, as Brownlee (2018) suggests. Data scientists can use past data trends to model future seasonal variations and cyclical data. By implementing various techniques and integrating technology, businesses can hugely benefit from analytics.
References
Andreoni, A., & Postorino, M. N. (2016). Time series models to forecast air transport demand: A study about a regional airport. IFAC Proceedings Volumes (IFAC-PapersOnline). 11. 101-106.
Brownlee, J. (2018). Machine Learning Mastery; Results from Comparing Classical and Machine Learning Methods for Time Series Forecasting. Machine Learning Mastery.
TranStats. (2021). Bureau of Transportation Statistics. From United States Department of Transportation Retrieved from https://www.transtats.bts.gov/Data_Elements_Financial.aspx?Qn6n=J
ORDER A PLAGIARISM-FREE PAPER HERE
We’ll write everything from scratch
Question 
The idea of this project is to familiarize students with their choice of industry and area of expertise with the
help of analytics. The project allows the opportunity to learn about trends and patterns in various facets of
industry domains as well as fields of interest (Finance, Marketing, and so on).
Business Analytics- Identifying Trends in US Airline Industry and Alaska Airlines Airlines Company
EXPECTATIONS
Candidates will be expected to use data to identify the problems or trends and patterns in their area of interest.
The process of identifying patterns or trends would be primarily based on the use and analytics of data using
various tools and techniques discussed in the class (central tendency, correlation, etc). The candidates should
be able to explain the significant changes in their data. Financial ratio analysis of a company is not allowed.
1.0 Introduction (~200-400)
1.1 Introduction
• Explain the relevance to the industry or company used in the analysis in conjunction with the
current business environment
• In a paragraph explain the purpose of the research, the relevance of the problem to the current
business environment
1.2 Objectives (deliverables)
• Objectives: clearly state the objective (similar to a research statement)
2.0 Data (~300)
• Discuss the data collected (only publicly available) and how it relates to the objective. (Do not
define the data)
• There must be at least 20 observations and 3 variables
• Explain how it relates to the research/analysis
• Mention the time frames and sources of the data (APA Style)
3.0 Analysis (~1200-1500)
• Elaborate the results and explain how it addresses the objectives
• Explain the results using Graphs/Charts and Tables
• Cohesive explanation required. Use the 3 questions – What has happened (Analytics), Why it
has happened and what does it mean for the business
4.0 Conclusion (~200-300)
• Conclude the overall result of the paper