Business Analytics- Central Tendencies for Bifurcation Analytics
1.0 Introduction
Data and sales are important metrics in business analytics at an organizational and national level. These statistics enable an organization to establish its position in performance in the relevant market compared to the industry performance. At a national level, sales data is one of the elements included in the calculation of a country’s GDP. The level of sales may also indicate the level of disposable income by individuals in a certain country. The current analysis aims at employing the central tendencies alongside other simple analytical methods and data visualization to generate insights about the performance of three retail sales sectors in the UK and establish whether there is a relationship between sales in the three sectors and the average employment rates in the UK. The sales are recorded in value non-seasonally adjusted totals for the last 22 months since January 2020. The sales are recorded in thousands of Euros.
Objectives/Deliverables
The main objectives of the current analysis include;
Deriving the central tendencies for the three sectorial total sales amounts
Establishing the sales trend over the period considered in the study
Deriving the trend of the employment rates in the UK for the period
Establishing whether there is a relationship between the total sales in the three sectors and employment rates.
2.0. Data
The data used for the analysis is obtained from the UK Office for National Statistics (2021). The time frame considered in order to meet the minimum variable requirements for the analysis is 22 months, between January 2020 and October 2021. The business data trends during this period portray insightful trends due to the changes in the market and business environment due to the global Coronavirus pandemic. Particularly, the pandemic has had several negative implications for businesses and economies at large. The study focuses on sales value in the three sectors, which are the dependent variables, to determine how the independent variable changes the dependent variable. The variables in the study are;
Dependent Variables: Food Store Sales, Non-specialized store sales, and textile, clothing, and footwear stores.
Independent Variable: Employment Rates
One of the factors that affect total retail sales in a sector is the disposable income of individuals in a country. The disposable income is affected by the rates of employment in a country. Thus, the variables have a cause-effect relationship that can be established under the various business analytics models. The data will be analyzed quantitatively to answer the questions of what has happened, why it has happened, and what it means for the business. The study’s findings can be used to explain the trends in business performance over the period.
3.0 Analysis
The quantitative analysis explores central tendencies and how bifurcation applies to the variables considered in the study. According to Karaaslanh (2012), bifurcation has several meanings in different contexts. Basically, it entails the division of a larger body or concept into smaller and related units. In an analytical study, bifurcation could entail dividing a large variable or theme into sub-variables or subthemes to enhance analysis. The bifurcation analytics is included in the appendix.
| Employment Rates (%) | Predominantly food stores | Non-specialized stores | Textile, clothing and footwear stores | |
| Mean | 75.20909091 | 14766376.64 | 2679334.955 | 3192824.818 |
| Standard Error | 0.120588221 | 417096.722 | 134554.5536 | 233134.5904 |
| Median | 74.95 | 13631157 | 2554576 | 3280062 |
| Mode | 74.7 | #N/A | #N/A | #N/A |
| Standard Deviation | 0.565608893 | 1956357.038 | 631116.7986 | 1093498.157 |
| Sample Variance | 0.31991342 | 3.82733E+12 | 3.98308E+11 | 1.19574E+12 |
| Minimum | 74.6 | 12593746 | 1807685 | 1133350 |
| Maximum | 76.5 | 18753796 | 4812427 | 5528386 |
| Sum | 1654.6 | 324860286 | 58945369 | 70242146 |
| Count | 22 | 22 | 22 | 22 |
Table 1: Central Tendencies and Other Descriptive Statistics for the Variables
The mean, mode, and median constitute the measures of central tendency for a set of variables. These statistics provide basic insights about the trends of the studied variables, especially by locating the central location or a range where the data is concentrated more. For employment rates, the mean is 75.21%, which indicates that the mean employment rates for the period when the study is conducted is lower than the preceding year mean before the pandemic. The median also deviates from the mean. Ideally, after the onset of the pandemic, the employment rates decreased due to the closure of businesses. The modal employment rate is 74.7%, indicating that several months had an employment rate of 74.7%. For predominantly food stores, the central tendencies indicate that the mean sales are £14766376640. The median is £13631157000, implying that most monthly sales values are above the mean sales.
For non-specialized stores, the mean is £2679334955, and the median is £2554576000. This implies that for most of the months, the sales were above the median. The mean sales for textile, clothing and footwear stores is £3192824818, while the median is £3280062000. Most of the monthly sales were below the median sales amount for the sector. There was no modal sales value for the three sectors. These statistics can also be regarded as summary statistics since they summarise the data.
Employment Rates
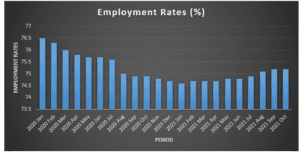
Figure 1: Employment Rates Trend
The employment rate was the independent variable that had a cause-effect relationship with the independent variable. The analysis indicates that employment rates decreased steadily from January 2020 to January 2021, with a downward trend. The decrease in employment rates is largely attributable to the global Coronavirus pandemic that led to the closure of businesses and sectors due to measures imposed to curb the spread of the disease. The employment rates increased from January 2021 after the measures were eased due to the discovery of vaccines to fight the disease. However, the UK labour market has not yet returned to normalcy and Office of National Statistics data indicates that the country’s employment rates remain below the average national employment rates between 2010 and 2019. The decreased employment rates have implications for businesses, especially depicted through decreased sales in various sectors. The relationship between the rates of employment and the sales in the three sectors will also be established.
Sales in Predominantly Food Stores
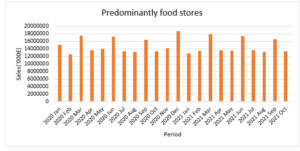
Figure 2: Sales in Predominantly Food Stores
Sales in predominantly food stores is the data from food stores that mainly deal in food sales in the UK. The sales data for predominantly food stores indicate no particular trend in sales between January 2020 and January 2021. The highest monthly sales amount was recorded in December 2020, which was attributable to the festive season spending on food and related products. The lowest amount of sales was in February 2020.
Sales for Non-Specialized Stores
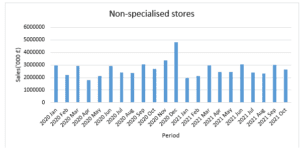
Figure 3: Sales for Non-Specialized Stores
Similar to food stores’ sales, non-specialized stores did not have a particular trend in sales value over the period. The lowest sales amount was in April 2020. The highest monthly sales in non-specialized stores were in December 2020 due to high spending during the festive season. However, the average sales for the period covered remain averagely low compared to the previous period before the onset of the pandemic.
Sales for Textile. Clothing and Footwear Stores
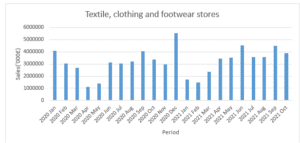
Figure 4: Sales for Textile. Clothing and Footwear Stores
Textile, clothing, and footwear stores generally experienced the least sales by value between January 2020 and January 2021. In April 2020, the sector recorded the lowest sales value over the period. Similar to other sectors, the highest sales in textile, clothing, and footwear were recorded in December 2020. The industry forecasts a similar increase in sales in December 2021. However, the sector experienced the largest negative change in sales value between December 2020 and February 2020 compared to other sectors. An upward trend has been recorded from February 2021 to October 2021.
| Employment Rates (%) | Predominantly food stores | Non-specialized stores | Textile, clothing and footwear stores | |
| Employment Rates (%) | 1 | |||
| Predominantly food stores | -0.035236845 | 1 | ||
| Non-specialized stores | -0.191062108 | 0.752648933 | 1 | |
| Textile, clothing and footwear stores | -0.136537244 | 0.428624857 | 0.726017015 | 1 |
Table 2: Correlation between the Rates of Employment and Sales in the Three Sectors
The correlation models the relationship between the variables in the analysis. The correlation portrays an interesting relationship between the variables. The results of the study indicate that there is a negative relationship between the rates of employment and the sales volume in the three sectors. This does not imply that the increase in employment rates leads to a decrease in sales volumes in the three sectors. Typically, the expectation is that the employment rates increase the disposable income, which means that people spend more and sales increase subsequently. In the context of the current study, the correlation indicating a decrease in sales when the employment rates increased implies that, although individuals had more disposable income, they did not spend more in food stores, non-specialized stores, and textile, clothing, and footwear stores. The findings indicate that individuals may have shifted spending from the three sectors to other sectors, such as local, international traveling, and tourism sectors that experienced increasing revenue and had a positive relationship with employment rates during the same period. The correlation values indicate a strong negative relationship between non-specialized stores and employment rates. Predominantly, food stores had the weakest negative relationship with employment rates. However, the three sectors had a weak negative relationship with employment rates.
The negative relationship has several implications for the businesses in the three sectors, which might occur due to several factors other than income availability. Firstly, it might be due to a change in customer preferences. For instance, other than purchasing from textile, footwear, and clothing stores, the increased business activity due to the ease of lockdown measures allowed people to purchase second-hand clothes and footwear from open markets and other shops. This leads to decreased sales in the stores. Secondly, the businesses under the businesses in the three sectors should re-evaluate the quality of their products. The negative relationship may be due to low-quality goods and services, which means that the businesses should improve. Thirdly, due to ineffective or decreased advertising and product promotion, the sectors could have experienced decreased sales. This means that businesses should revamp their advertising and product promotion strategies to reach more customers and create awareness. Finally, the relationship can be explained by an increase in the employment rate and decreased revenue earned from such employment. Besides, when income remains constant and employees’ needs increase, some sectors are more likely to experience decreased sales.
4.0 Conclusion
The study offers insight into the market trends and dynamics based on the central tendencies and the graphical representation of the findings. Generally, the study establishes that the value of sales in the three sectors remained considerably low compared to other periods before the Corona era. Additionally, several factors may have contributed to the observed central tendencies and relationships between the variables. Other than the pandemic, the global sales pattern can be influenced by several factors that include changing customer preferences, advertising strategies, available income, and quality of products and services. The findings coincide with other studies that have established that employment rates remain low in the UK and across other parts of the world. The study also indicates that the festive season is suitable for attracting buyers through various techniques, such as discounted products and aggressive product promotion. This is because both sectors experienced the highest sales during the month of December. Therefore, the study meets the objectives and significantly contributes to analytical insight into the topic.
References
Karaaslanh, C. C. (2012). Bifurcation Analysis and Its Applications. DOI: 10.5772/50075
Office for National Statistics. (2021). Sales. https://www.ons.gov.uk/
ORDER A PLAGIARISM-FREE PAPER HERE
We’ll write everything from scratch
Question 
The idea is to apply bifurcation analytics, as discussed in the class. From the paper, students will demonstrate
how central tendencies can be used with bifurcation analytics to provide insights and answer the 3 questions
“cohesively” along with the simple data presentation that indicates trends or patterns. The candidates should be
able to explain the significant changes in their data. A company’s financial ratio analysis is not allowed. You
can use Kaggle or Statistics Canada if you have difficulty finding data.
Business Analytics- Central Tendencies for Bifurcation Analytics
1.0 Introduction (~200)
1.1 Introduction
• General overview of the paper. Don’t go into too much detail here
1.2 Objectives (deliverables)
• Objectives: clearly state the objective.
2.0 Data (~200)
• Mention the variables (just list them), time frames, and sources of the data (APA Style)
3.0 Analysis (~1200-1500)
• Explain the results using Graphs/Charts and summary analytics tables (Complete bifurcation
analytics in the appendix)
• Cohesive explanation required. Use the 3 questions – What has happened (Analytics), Why it
has happened (APA intext citation required), and what does it mean for the business
4.0 Conclusion (~200-300)
• Conclude overall findings of the paper