Archival Data Analysis
Part 1: Internet Data Usage and Age Over Time
Based on the data presented in Table 1 below, it is evident that there exists a correlation between adult internet utilization and age spanning from the years 2000 to 2018.
Table 1
U.S. Adult Internet Usage
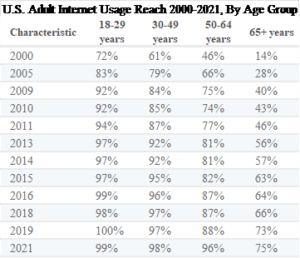
Note. From “U.S. Adult Internet Usage Reach 2000-2021, by Age Group,” A. Petrosyan, 2023, Statista, https://www.statista.com/statistics/184389/adult-internet-users-in-the-us-by-age-since-2000/. Copyright 2023 by Statista.
The data from Table 1 above was used to create a chart, which is presented as follows:
Figure 1
U.S. Adult Internet Usage by Age from 2000 to 2021
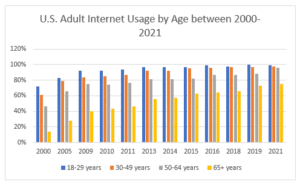
Figure 1 illustrates a discernible correlation between adult internet usage and age over the period spanning from 2000 to 2018. Evidently, the younger demographic exhibits markedly higher levels of internet engagement compared to their older counterparts throughout the specified timeframe. In particular, individuals falling within the 18-29 age bracket consistently demonstrate a pronounced predilection for internet utilization, surpassing other age cohorts. This empirical observation finds robust support in the “U.S. Internet Usage Penetration 2021, by Age Group” dataset accessible via Statista (Petrosyan, 2023c). Reportedly, nearly 100% of individuals aged between 18 and 29 years in the United States were active Internet users in 2021. Conversely, individuals aged 65 years and above exhibited a usage rate of 75% during the same period. Similarly, the demographic aged 30-49 years exhibited a higher incidence of internet usage in contrast to those in the 50-64 and 65+ age brackets.
Considering the temporal dimension, it is noteworthy that all age cohorts demonstrated a surge in internet usage from 2000 to 2018. Remarkably, individuals aged 65 years and above manifest a substantially more pronounced upswing in adult internet engagement than their counterparts in different age brackets. Intriguingly, individuals aged 18-29 years exhibit a comparatively modest increase in adult internet usage over the same period in contrast to other age groups. These insights are corroborated by data from the ITU dataset, “Percentage of Population Using the Internet in the United States from 2000 to 2019,” retrievable from the Statista platform. According to ITU (2021), internet usage experienced a consistent upward trajectory across all age demographics from 2000 to 2018, with only 2011 showing a marginal dip in overall internet engagement. This trend is vividly reflected in Figure 2, indicating an internet penetration rate of 43% in 2000 as opposed to 87.27% in 2018. The graphical representation of these findings is presented in Figure 2 below.
Figure 2
Percentage of Population Using the Internet in the U.S. from 2000 to 2023
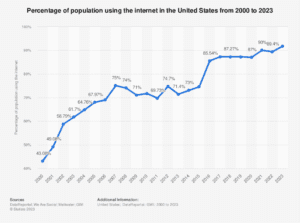
Note. From “Percentage of Population Using the Internet in the United States from 2000 to 2023,” A. Petrosyan, 2023, Statista, https://www.statista.com/statistics/209117/us-internet-penetration/. Copyright 2023 by Statista.
Part 2: Data Breaches in Health Care Over Time
Figure 3 presents data from the US HHS pertaining to resolved data breach reports from 2017 to 2021. The chart indicates a rise in healthcare data breaches in the U.S. from 2017 to 2019, followed by a decline from 2019 to 2021 (U.S. Department of Health & Human Services, 2021). Notably, a substantial surge can be observed between 2018 and 2019, contrasted with a significant downturn between 2020 and 2021.
Figure 3
Number of Breaches
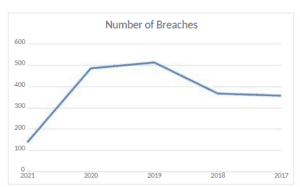
Note. Adapted from “U.S. Department of Health & Human Services – Office for Civil Rights,” U.S. Department of Health & Human Services, 2021, Hhs.gov, https://ocrportal.hhs.gov/ocr/breach/breach_report.jsf.
Seh et al.’s (2020) study, “Healthcare Data Breaches: Insights and Implications,” substantiates the findings above. The research examines data breaches across industry sectors from 2005 to 2019, offering a 15-year overview, and specifically focuses on the period from 2015 to 2019, a five-year span. As illustrated in Table 2 below, which is an extract from Seh et al. (2020), the healthcare sector has experienced the highest incidence of data breaches in the last five years, surpassing the combined breaches in all other industries.
Table 2
Data Breaches by Sector (2005 to 2015)
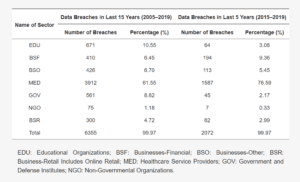
Note. From “Healthcare Data Breaches: Insights and Implications,” A. H. Seh, M. Zarour, M. Alenezi, A. K. Sarkar, A. Agrawal, R. Kumar, and R. A. Khan, 2020., Healthcare, 8(2), 133. NCBI. https://doi.org/10.3390/healthcare8020133.
Part 3: Archived Dataset
Dataset Name
Factors affecting return to the office after the COVID-19 pandemic in Poland 2021
Dataset Source
Daily Fruits
Dataset Location
Statista.com: https://www.statista.com/statistics/1251000/poland-factors-affecting-return-to-the-office-after-covid-19/
Dataset Overview
The dataset titled “Factors Affecting Return to the Office after COVID-19 Pandemic in Poland 2021” was gathered in Poland by Daily Fruits from May 13 to May 24, 2021. This survey was conducted through computer-assisted telephone interviews, targeting 250 participants consisting of Company Directors, Executives, and HR specialists. The primary objective of this data collection initiative was to delve into the pivotal considerations that influenced organizations in their consequential determinations regarding the resumption of on-site work amid the COVID-19 pandemic.
Dataset Timeframe
The data collection period for this dataset ranged from May 13, 2021, to May 24, 2021.
Four Variables
The dataset encompassed four variables. These include location-specific incidence statistics, headquarters’ decisions, Employees’ opinions, and disease statistics in Poland.
Variable 1: Location Specific Incidence
Definition of the Variable. Not available.
Source of Data. Survey: CATI or Computer-assisted telephone interviews.
Scoring of the Variable. Not available.
Level of Measurement. Nominal
Score Range and Interpretation. Not available.
Variable 2: Headquarters’ Decision
Definition of the Variable. Not available.
Source of Data. Survey: CATI or Computer-assisted telephone interviews.
Scoring of the Variable. Not available.
Level of Measurement. Nominal
Score Range and Interpretation. Not available.
Variable 3: Employee Opinions
Definition of the Variable. Not available.
Source of Data. Survey: CATI or Computer-assisted telephone interviews.
Scoring of the Variable. Not available.
Level of Measurement. Nominal
Score Range and Interpretation. Not available.
Variable 4: Disease Statistics in Poland
Definition of the Variable. Not available.
Source of Data. Survey: CATI or Computer-assisted telephone interviews.
Scoring of the Variable. Not available.
Level of Measurement. Nominal
Score Range and Interpretation. Not available.
Reflection
In dissertation studies, data collection plays a pivotal role, serving as the means to test hypotheses, particularly in quantitative research. Even in qualitative studies, researchers collect data to address the research questions at hand. This process involves direct interaction between the primary investigator and research participants, employing methods like surveys, interviews, focus groups, and observations, resulting in the acquisition of primary data. However, it is important to note that primary data collection is not always the norm. In certain instances, researchers may utilize data that was originally gathered for different purposes. This type of data is commonly referred to as archival data. It may either be in a processed form, ready for use, or in its raw state, awaiting specific research design applications.
Advantages of Archival Data
There are several notable advantages and disadvantages associated with using archival data in research endeavors. One significant advantage of utilizing archival data is its savings in terms of both time and financial resources. Given that the data is already available, researchers can make considerable strides in terms of time efficiency, a particularly crucial factor when dealing with large datasets (Fisher et al., 2022). This circumvents the challenges and time-consuming nature of collecting extensive data for a dissertation study. Moreover, archival data is more likely to have been processed by statisticians with expertise in the field. This diminishes the need for corrections related to issues like observer bias, flawed sampling techniques, or a lack of inter-rater reliability (Fisher et al., 2022). When data is free from such complications, it becomes more readily usable, further contributing to time efficiency, a distinct advantage for the researcher.
Another key benefit is that archival data can provide a broader perspective on the study topic, potentially revealing patterns and insights that were previously overlooked. This expanded viewpoint can greatly enhance the effectiveness of a dissertation study. Additionally, the larger sample sizes characteristic of archival data enable researchers to perform more robust statistical analyses (Fisher et al., 2022). Thus, the utilization of archival data offers significant advantages, including time and cost savings, as well as a broader scope of data and research perspectives. Additionally, it is worth noting that some archival data is freely accessible, alleviating the need for researchers to allocate funds for its acquisition. Furthermore, readily available data streamlines the process by eliminating the time required for collection, sorting, cleaning, and rectifying potential statistical issues.
Disadvantages of Archival Data
While archival data offers distinct advantages, it is not without its share of challenges and drawbacks that researchers should be cognizant of. One significant hurdle lies in the process of locating existing data, particularly when comprehensive information about the dataset is not readily accessible. For instance, in the case of the dataset utilized in Part 3, “Factors Affecting Return to the Office after COVID-19 Pandemic in Poland 2021,” critical details such as variable definitions, scoring methods, score ranges, and interpretations were not readily available. Moreover, only processed data was accessible, and raw data remained elusive. This situation necessitates additional time and effort on the researcher’s part to track down the missing information, which may not always be feasible.
Another noteworthy challenge arises from the potential misalignment between the archival data and the specific research questions and hypotheses underpinning the dissertation study. Archival data may have been gathered with a distinct focus and purpose that may not seamlessly align with the specific inquiries at hand. This mismatch can introduce complexities and may require the researcher to adapt or manipulate the data to suit the study’s objectives, potentially introducing sources of error or bias (Ventresca & Mohr, 2017). Furthermore, there may be instances where archival data is not readily accessible without incurring a cost. In such cases, researchers may need to allocate financial resources to gain full access to the data. This financial investment can be a consideration for researchers operating within constrained budgets, and it is important to weigh the potential benefits against the associated costs.
Navigating these challenges requires careful planning and a proactive approach. Researchers should anticipate potential gaps in information and plan for additional time to address them. Additionally, becoming thoroughly acquainted with the data is imperative, particularly for researchers who may not possess advanced statistical expertise. This familiarity ensures that the data is handled appropriately and that any potential limitations or biases are acknowledged and addressed. Moreover, it is essential to acknowledge that researchers have limited control over how archival data was originally collected (Ventresca & Mohr, 2017). This lack of control introduces an element of uncertainty regarding the data’s reliability and its suitability for addressing critical research questions. Researchers must exercise diligence in evaluating the quality and relevance of archival data to ensure it meets the rigorous standards expected of a dissertation study.
Conclusion
In sum, while archival data offers valuable opportunities for research, researchers must be prepared to address challenges related to data availability, alignment with research questions, and potential costs. Nonetheless, with careful planning, thorough evaluation, and a proactive approach, researchers can effectively harness the benefits of archival data while mitigating its inherent limitations.
References
Fisher, G. G., Barnes-Farrell, J. L., Beckel, J. L., & Shultz, K. S. (2022). Using archival data to research age and work. Routledge EBooks, 219–237. https://doi.org/10.4324/9781003089674-16
ITU. (2021). Internet penetration United States | Statista. Statista; Statista. https://www.statista.com/statistics/209117/us-internet-penetration/
Petrosyan, A. (2023a, February 13). U.S. adult internet usage reach 2000-2021, by age group. Statista. https://www.statista.com/statistics/184389/adult-internet-users-in-the-us-by-age-since-2000/
Petrosyan, A. (2023b, February 20). Percentage of population using the internet in the United States from 2000 to 2023. Statista. https://www.statista.com/statistics/209117/us-internet-penetration/
Petrosyan, A. (2023c, August 30). U.S. Internet Usage Penetration 2021, by age group. Statista. https://www.statista.com/statistics/266587/percentage-of-internet-users-by-age-groups-in-the-us/
Seh, A. H., Zarour, M., Alenezi, M., Sarkar, A. K., Agrawal, A., Kumar, R., & Khan, R. A. (2020). Healthcare data breaches: Insights and implications. Healthcare, 8(2), 133. NCBI. https://doi.org/10.3390/healthcare8020133
U.S. Department of Health & Human Services. (2021). U.S. Department of Health & Human Services – Office for Civil Rights. Hhs.gov. https://ocrportal.hhs.gov/ocr/breach/breach_report.jsf
Ventresca, M. J., & Mohr, J. W. (2017). Archival research methods. The Blackwell Companion to Organizations, 805–828. https://doi.org/10.1002/9781405164061.ch35
ORDER A PLAGIARISM-FREE PAPER HERE
We’ll write everything from scratch
Question 
Archival Data Analysis
For Parts 1 and 2:
Go to the NU Library from your home page. Examine the guide to primary and secondary sources to see what is available. This can be found under Research Help → Research Process → Determining Information Needs → Primary and Secondary Resources. Then, go back to the library home page and either conduct a search using the NavigatorSearch in the middle of the page or go to the Statista database in the A-Z Databases list to locate data to answer the following questions. The library’s guide on Statistics may also be helpful.
Use tables and figures to explain your determination and support your rationale in answering the question. Be specific. Practice creating your own tables and figures to support your conclusion. You cannot use tables and/or figures from another source without copyright permission in your published dissertation research study. Be sure to cite the source of the table/figure using APA formatting.
Part 1: Internet Data Usage and Age Over Time
Does there appear to be a relationship between adult internet usage and age between 2000 and 2018?
Part 2: Data Breaches in Health Care Over Time
Has the incidence of data breaches in the health/medical sector increased in the last five years?
Part 3: Archived Dataset
Identify one dataset (also referred to as a database) that is publicly available for research. A list of possible sources is included in this week’s resources, or choose one that may be appropriate for your research study topic. You do not need to open the dataset that includes raw numbers.
To operationalize the dataset, gather the following information about the dataset. Dataset information is most likely contained in a document separate from the dataset and may be identified as a database dictionary, codebook, or program record layout. For the assignment response, include the following information using the headings and format outlined here:
ASSIGNMENT OUTLINE START
Dataset Name.
Enter text on this line.
Dataset Source.
Enter text on this line.
Dataset Location.
Enter text on this line. (include a link if available)
Dataset Overview.
Include three to five sentences to provide context for the Reader. This may include industry, focus, and original purpose for collecting the data.
Dataset Timeframe.
Enter text on this line.
Four Variables.
For each of the four variables, separately list the following information, using separate headings for each variable. If the information is not available, then indicate ‘not available.’ Follow the template below for each of the variables/constructs.
State Variable Name [include dataset abbreviation if appropriate]
Definition of the Variable. Enter text here.
Source of Data. (This might be self-reported by business, self-reported by survey, observation, etc.)
Scoring of the Variable. Enter text here. For variables, this might be age in years, number of defects per quarter, group membership, etc. For constructs, this might be the computation of multiple questions on a survey or multiple variables that make up the construct.
Level of Measurement. Enter text here. Below is a reminder of the measurement levels you learned in Statistics 1. Do not include the definitions of measurement level in your assignment response.
Nominal. Nominal data are measured at the discrete level, depicting independent categories with no underlying order. Examples of nominal data are sex, race, and organizational department membership.
Ordinal. Ordinal data are measured at the discrete level with separate categories that imply an underlying hierarchy. Examples of nominal data are education level, age groups, or simply categories of high, medium, and low. Some Likert scales may be deemed by the researcher as ordinal data.
Interval. Interval data are measured on a continuous scale with ‘equal-appearing’ intervals and without an absolute zero point. Examples of interval data are time, temperature, credit score, and test scores. Some Likert scales may be deemed by the researcher as interval data.
Ratio. Ratio data are measured on a continuous scale with equal intervals and an absolute zero point. Examples of ratio data are age, income, and defects per lot. A researcher may deem an otherwise ratio data as an interval if, for purposes of the research, the measurement level truncates the zero point or otherwise holds a floor or ceiling effect.
Score Range and Interpretation. Enter text here. Include the total possible range of scores for the variable and how to interpret the range. The score range and interpretation might be a six-point Likert scale with ‘1’ meaning “Not Satisfied at All,” and ‘6’ meaning ‘Completely Satisfied;’ or perhaps a four-point ordinal scale with ‘1’ meaning no use, ‘2’ meaning little use, ‘3’ meaning moderate use, and ‘4’ meaning a lot of use. For nominal variables that form a discrete category, then identify the coding scheme, for example, 1 = male; 2 = female.
Reflection.
Enter text here. Describe advantages, disadvantages, challenges, and benefits that you feel should be considered if you were to use an archived dataset for your dissertation research study.