Applying Normal Distribution
The concept of normal distribution is of utmost importance in statistical analysis, serving as a fundamental framework for comprehending the extent of variability present in data. The distribution under consideration exhibits a symmetrical and bell-shaped curve, wherein the majority of observations are concentrated in close proximity to the mean. This assignment aims to investigate the fundamental properties of the normal distribution, elucidate its pervasive presence across diverse domains of existence, delve into the profound significance of the Central Limit Theorem, and scrutinize the practicality of utilizing z-scores for probabilistic assessments. Furthermore, we shall apply these theoretical principles to hypothetical situations encompassing random samples of college students from diverse states. Our assignment writing help is at affordable prices to students of all academic levels and academic disciplines.
Normal Curve and its Characteristics
The normal distribution, also known as the Gaussian distribution, is characterized by its bell-shaped and symmetrical nature. It exhibits a high concentration of data points around the mean, resulting in a prominent peak at the center. The distribution under consideration exhibits two key parameters: the population mean and the population standard deviation. These parameters play a crucial role in determining the central tendency and variability of the distribution, respectively. In an optimal situation, the bell-shaped curve symbolizes an impeccable representation of a continuous random variable, wherein approximately 68% of the observations lie within one standard deviation of the mean, about 95% within two standard deviations, and nearly 99.7% within three standard deviations.
In empirical sample distributions, it is uncommon for the normal curve to exhibit a perfect fit due to the influence of multiple sources of variability and the occurrence of outliers. Various factors, including measurement error, sampling bias, and inherent population differences, are known to contribute to deviations from the ideal curve. Although it is acknowledged that limitations may exist, it is important to recognize that these limitations do not undermine the usefulness of the normal distribution as a theoretical framework. In fact, the normal distribution continues to offer valuable insights into the characteristics and patterns exhibited by random variables.
In the context of BIG DATA, diminishing concerns regarding the deviations from a perfect normal distribution are observed. Given a sufficiently large sample size, it is pertinent to note that the Central Limit Theorem (CLT) becomes applicable. This theorem states that the sample mean tends to follow a normal distribution, irrespective of the original distribution of the population (Zhang et al., 2022). The ability to withstand deviations from normality is a fundamental characteristic of statistical inference when dealing with extensive datasets.
Ubiquity of the Normal Distribution
The normal distribution holds significant importance in various aspects of our daily lives owing to the Central Limit Theorem. This theorem establishes that as the sample size expands, the distribution of the sample mean tends to approximate a normal distribution, irrespective of the underlying shape of the population distribution. The aforementioned theorem is a fundamental principle for various statistical methodologies and serves as a foundation for drawing conclusions about populations using sample data. As a result, it is noteworthy to highlight that the normal distribution holds a pivotal role as a fundamental instrument in various domains, encompassing the natural sciences, social sciences, and finance.
The use of the bell curve stems from its ability to effectively depict the normal distribution, as it offers a perceptually accessible graphical portrayal of the concentration of data points in proximity to the mean. The symmetrical nature of its shape lends itself to facile comprehension and manipulation, rendering it a pragmatic selection for the purpose of visualizing and scrutinizing data. Alternative shapes, such as skewed or multimodal distributions, may exhibit reduced efficacy in visually representing the measures of central tendency and dispersion of data.
Central Limit Theorem and its Significance
The Central Limit Theorem (CLT) is a fundamental principle in the field of statistics. It states that as the size of a sample increases, the distribution of the sample mean will converge to a normal distribution (Zhang et al., 2022). This convergence occurs irrespective of the underlying shape of the population distribution. The aforementioned theorem plays a crucial role in establishing a connection between sample statistics and population parameters (Zhang et al., 2022). The utilization of statistical inference allows for the extrapolation of conclusions about the overall population by utilizing a subset of data known as a sample. This process serves as a fundamental component in hypothesis testing and the estimation of confidence intervals.
The CLT is a fundamental concept in statistics that enables us to transition from analyzing a specific sample to drawing inferences about the entire population by constructing a sampling distribution. The distribution in question serves as a valuable tool for assessing the dispersion of sample statistics and the fundamental framework for generating probabilistic assertions regarding the population.
Application of Central Limit Theorem to the Sample Mean
According to the Central Limit Theorem, it is evident that the sampling distribution of the sample mean will exhibit a close resemblance to a normal distribution, irrespective of the underlying distribution of the population. The concept holds significant statistical power as it enables us to articulate precise assertions regarding the characteristics and tendencies exhibited by sample means (Bodnar et al., 2019). Based on empirical evidence and statistical theory, it is reasonable to assert that when derived from a sufficiently large sample, the sample mean is expected to exhibit a high degree of proximity to the population mean.
It is imperative to acknowledge that possessing knowledge regarding the distribution of the population is not a prerequisite for the application of the Central Limit Theorem. The theorem exhibits robustness and maintains its validity even in scenarios where the distribution of the population is either unknown or does not follow a normal distribution. The inherent characteristic of the Central Limit Theorem renders it a highly adaptable and valuable instrument in statistical analysis.
Interpreting Published Exam Results
Based on the data provided, it can be inferred that the majority of the test takers, 75%, obtained scores below the mean score on the certification exam. This observation suggests that the distribution of scores is negatively skewed, as the tail of the distribution is extended towards the lower end. In a normally distributed dataset, 50% of the observations are above the mean, while the remaining 50% are positioned below it. In the context of a skewed distribution, it is observed that the tail of the distribution is extended towards one end, resulting in a greater proportion of scores falling below the mean (Bourguignon et al., 2021). The observed scenario suggests that the distribution of exam results deviates from the normal distribution, a phenomenon that is frequently observed in assessments conducted in real-world classroom settings.
Using Z-Scores for Probability Determination
In statistical research, z-scores are employed to assess probabilities due to their ability to offer a standardized metric indicating the deviation of a data point from the mean, expressed in terms of standard deviations. This feature facilitates the establishment of significant comparisons among various distributions or variables (Schober et al., 2021). Z-scores offer a distinct advantage to researchers as they allow for the evaluation of the relative position of a specific data point within a given distribution, regardless of the original units of measurement. In the context of standardized testing, z-scores play a crucial role in facilitating the comparison of scores obtained from different exams that possess varying levels of difficulty.
College Student Samples
Sampling Distribution for Age
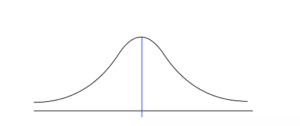
Based on the hypothetical scenario presented, it is reasonable to infer that if three distinct samples of college students were collected, specifically from Oregon, Montana, and Missouri, each consisting of 1000 students, the sampling distribution for age would plausibly exhibit characteristics that resemble a normal distribution. This assumption is based on the premise that the age distribution within each state exhibits a reasonable level of homogeneity and lacks significant skewness. Based on our analysis, it is highly probable that the means of these sampling distributions would exhibit a strong closeness to the mean ages of the corresponding state populations. The following is how the distribution curve will appear for age:
Sampling Distribution for Parent’s Age
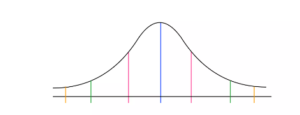
In line with the distribution of age, it is expected that the sampling distribution for the age of parents would exhibit a close approximation to a normal distribution, assuming that the distribution of parent ages within each state is relatively uniform. Nonetheless, it is worth noting that the means of these distributions would serve as a reliable representation of the mean parent ages within the corresponding state populations. The following is how the distribution curve will appear for the parent’s age:
Sampling Distribution for Number of Sick Days
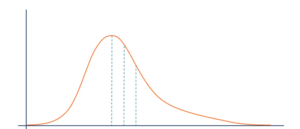
The observed distribution of sick days may display a positively skewed pattern in the sampling distribution. This phenomenon can be attributed to the presence of a positively skewed distribution among students’ sick days. The majority of students exhibit a lower frequency of sick days, while a smaller subset of students demonstrates a higher frequency, resulting in a right-skewed tail in the distribution. The sample mean of this distribution would serve as an estimator for the population mean, providing an approximation for the average number of sick days experienced by students in each state. The following is how the distribution curve will appear for the number of sick days:
Conclusion
A comprehensive grasp of probability concepts is essential in conducting dissertation research. The utilization of appropriate statistical methods is facilitated by the guidance provided by this framework. Additionally, it aids in comprehending and interpreting obtained results, ultimately enabling the researcher to draw valid and reliable conclusions. The utilization of probability concepts in research allows for the quantification of uncertainty, the establishment of confidence intervals, and the execution of hypothesis tests. Moreover, statistical methodologies offer a systematic approach to extrapolating conclusions from a limited sample to a larger population, guaranteeing the strength and dependability of research results. A comprehensive understanding of probability significantly augments the robustness and credibility of research methodologies, thereby facilitating the progression of knowledge within the specific domain.
Therefore, it can be inferred that the normal distribution, Central Limit Theorem, and z-scores are fundamental concepts in statistical analysis. The utilization of these applications spans a broad spectrum, encompassing data analysis in diverse domains as well as the formulation and elucidation of research designs. Gaining a comprehensive understanding of these fundamental concepts provides researchers with robust statistical tools that enable them to derive significant and valuable inferences. Through the analysis of data, we aim to facilitate the progress of knowledge and enable well-informed decision-making.
References
Bodnar, T., Mazur, S., & Parolya, N. (2019). Central limit theorems for functionals of large sample covariance matrix and mean vector in matrix‐variate location mixture of normal distributions. Scandinavian Journal of Statistics, 46(2), 636–660. https://doi.org/10.1111/sjos.12383
Bourguignon, M., Santos-Neto, M., & de Castro, M. (2021). A new regression model for positive random variables with skewed and long tails. METRON, 79(1), 33–55. https://doi.org/10.1007/s40300-021-00203-y
Schober, P., Mascha, E. J., & Vetter, T. R. (2021). Statistics from A (agreement) to Z (z Score): A Guide to Interpreting Common Measures of Association, Agreement, Diagnostic Accuracy, Effect Size, Heterogeneity, and Reliability in Medical Research. Anesthesia & Analgesia, 133(6), 1633–1641. https://doi.org/10.1213/ane.0000000000005773
Zhang, X., Astivia, O. L. O., Kroc, E., & Zumbo, B. D. (2022). How to think clearly about the central limit theorem. Psychological Methods. https://doi.org/10.1037/met0000448
ORDER A PLAGIARISM-FREE PAPER HERE
We’ll write everything from scratch
Question 
Applying Normal Distribution
Instructions
In this assignment, you will present your answers to the following questions in a formal paper format. Please separate each question with a short heading, e.g., normal curve, bell curve, etc.
Begin with a brief introduction in which you explain the importance of normal distribution.
Next, address the following questions in order:
Describe the characteristics of the normal curve and explain why the curve, in sample distributions, never perfectly matches the normal curve. Do we need to be concerned with this non-perfection in a BIG DATA scenario? Why or why not?
Why is the normal distribution so ubiquitous in our lives? Why is the bell curve used to represent the normal distribution? Why not a different shape? In what situation would we examine a normal distribution curve? In what situation would we examine a sampling distribution curve?
Why is the central limit theorem important in statistics? How does it help us to move from talking about a particular sample to the population via a sampling distribution?
What does the central limit theorem inform us about the sampling distribution of the sample mean? Do you need to know the distribution of your population to use the Central Limit Theorem? Why or why not?
Imagine that you recently took an exam for certification in your field. The certifying agency has published the results of the exam and 75% of the test takers in your group scored below the average. In a normal distribution, half of the scores would fall above the mean and the other half below. How can what the certifying agency published be true?
Why do researchers use z-scores to determine probabilities? What are the advantages of using z-scores? Provide examples of the z-score in use.
If we took three different samples of college students (one from Oregon, one from Montana, and one from Missouri) and each sample had 1000 students, what would the sampling distribution for age look like? What about your parents’ age? What about the number of sick days? Explain each response and draw a distribution curve for each event.
Conclude with a brief discussion of how the concept of probability might affect research that you might undertake in your dissertation project. In other words, how would a basic understanding of probability concepts aid you in analyzing and interpreting data?
This assignment should be 5-7 pages, not including the title page and reference page. It should include a minimum of 3 scholarly resources.