ECO 202 Simulation Checkpoint Assignment

Economic Summary Report
Introduction
For the benefit of the incoming administration, I submit this report to document, analyze, and interpret the macroeconomic policy decisions I made as the chief economic policy advisor of Econland. This document aims to further our national prosperity by deepening our understanding of the relationship between macroeconomic policies and their consequences for our citizens. The report includes a thorough account of the major fiscal and monetary policy decisions made over each of the seven years of my term, as well as an explanation of the underlying rationales for those decisions and the resulting impacts of those policies: ECO 202 Simulation Checkpoint Assignment.
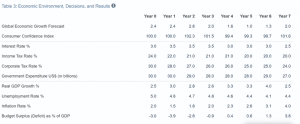
Table 1
The table above summarizes the macroeconomic climate of Econland over my term. Notably, this analysis is based on the roller coaster scenario, which is characterized by fast economic development and instability. Overall, I was able to maintain economic stability and get a high average approval rating of 94. The economy grew at a good pace, having reduced government expenditure and achieved a budget surplus.
Fiscal Policy: Government Expenditure
To avoid keeping a large surplus or deficit, government spending was closely monitored during the seven years. Spending was increased and decreased by the prior impacts of changes on GDP. Overall, expenditure had a reducing net effect and brought the budget deficit under control, taking into account that this can dwindle economic growth.
The fiscal policy approach adopted intended to increase government spending in the economy to boost economic growth, which would not have been possible without reducing the budget deficit significantly. As the budget deficit was reduced on the road to attaining a budget surplus, the government was able to reduce the interest rates gradually as a measure to boost economic growth.
The fiscal policy addressed government spending and taxation to improve Econland’s economic situation. The goal of both policy impacts was to influence aggregate demand. Mankiw (2021) asserts that lower corporate taxes encourage investment spending, which raises aggregate demand.
Government spending and reduced taxes also contribute to the same. As a result, the economy achieved an average GDP growth. Essentially, this occasioned a reduced unemployment rate in the economy. Therefore, the fiscal policy adopted proved to be effective in yielding positive outcomes.
Monetary Policies
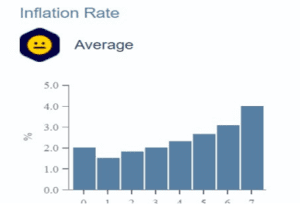
Figure 1
Interest rate levels we stale across the seven years. In the initial year, the interest rate started at 3% and reduced to 1.5%. Notably, this increased to 2% and remained steady across the period before falling to 1% across the last three years. Essentially, this has a massive impact on inflation levels in the economy.
The inflation rate reduced in the initial period before picking an increasing trajectory for the entire period. Notably, the change in interest rates was in line with shifts in investment and savings. Due to a robust economy, interest rates were maintained at the same level for most of the years. However, the investments had begun to decline in the fourth year.
To assess the impact, interest rates were lowered in line with taxes; however, because of the poor reaction in year four, more drastic modifications had to be made in the following two years. By the conclusion of the term, everything had stabilized and produced favourable outcomes.
As interest rates reduced to a stable trend, a booming economy was sustained and people’s ability to purchase increased. As a result, the inflation rate kept rising across the periods. According to Cochrane (2024), interest rates have an inverse relationship with inflation rates. Notably, this is in line with the Econland economic performance.
An example for illustration can be adopted from the period of economic recession occasioned by the Covid-19 pandemic. The Federal Reserve made sure that interest rates stayed low until full employment and a target of 2% inflation rate were reached in the prevailing economic environment. Even though this was a risky move, it was projected that the economy would continue to grow profitably by 2023, when the situation could have finally been contained globally.
As this happened, inflation rates grew to unprecedented levels. Notably, this example depicts the economy of Econland whereby interest rates remained low for most of the periods. Inflation rates kept rising during this period as was in the case of the U.S. during the pandemic.
Conclusion
From the beginning until the end, Econland’s economy remained stable. However, this does not imply that there were no economic challenges. It shows that despite the difficulties, Econland was able to go forward thanks to the economic decisions that were taken and put into action.
In essence, it was interesting to observe how economic decisions made across the period resulted in tangible results that could be measured. Overall, this provided a great experience that could shape the future in terms of economic decision-making.
References
Cochrane, J. H. (2024). Expectations and the neutrality of interest rates. Review of Economic Dynamics, 53, 194-223. https://doi.org/10.1016/j.red.2024.04.004
Mankiw, N. G. (2024). Principles of economics (10th ed.). Cengage Learning.
ORDER A PLAGIARISM-FREE PAPER HERE
We’ll write everything from scratch
Question 
Overview
The simulation checkpoint assignment in this course directly supports your success on the course project. You will play the simulation game, snip relevant image files from your simulation report, and discuss learned concepts and experiences in your submission.
Directions
For this assignment, you will play the first run of the Macroeconomics Simulation: Econland from Harvard Business Publishing, in which you will act as policy adviser for the fictional country of Econland. Select the Base Case scenario for this practice run. You may play the simulation as many times as you like. This will directly support your success in your course project, due in Module Eight.
Use the provided template linked in the What to Submit section to complete this checkpoint assignment. It is an abridged version of the template you will complete for your project in Module Eight. Note that the sections you create for this assignment cannot be copied and pasted into the project template because the project includes additional components.
Remember to include the required images from your simulation report. For help with this, see the Supporting Materials section below.
Specifically, address the following in your submission:
ECO 202 Simulation Checkpoint Assignment
- Introduction
- Add Table 3 from your simulation results to the provided area (Table 1) in the template.
- Draft a two- to three-sentence summary characterizing your overall performance and approval ratings as the chief economic policy advisor of Econland.
- Fiscal Policies: Government Expenditure
- Explain your decision-making regarding government expenditure and how it changed based on the macroeconomic conditions. What was the intent of your fiscal policy decisions in response to the given economic climate?
- Evaluate your fiscal policy decisions, including how they impacted key macroeconomic factors such as real GDP growth and unemployment. To what extent did your policies yield positive or negative outcomes?
- Monetary Policies
- Add the “Inflation Rate” graph from your simulation results to the provided area (Figure 1) in the template.
- Explain how you changed the interest rate levels and how this change impacted inflation. Provide specific examples to illustrate.
What to Submit
Template: Module Three Simulation Checkpoint Assignment Template
Use this template to develop your checkpoint assignment and submit it for grading. Sources should be cited according to APA style.