Dataset- CDC Birth Data Summary
The natality data set from the Center for Disease Control and Prevention (CDC) contains statistics of live births occurring within the United States. The data includes demographic information of the mother, the child, and the father (“Google Cloud Platform,” 2020). For instance, the details of the county of residence of the mother, age, race, marital status, and ethnicity are collected. It also contains mobility-related data such as prenatal care visits, method of delivery, and congenital anomalies (“Google Cloud Platform,” 2020). The data can be used in answering questions aimed at implementing data-based strategies to improve the health of the mother and the child. The questions covered in this paper are aimed at determining the relationship between poverty levels and maternal morbidity, poverty levels, and prenatal visits, and commute time and prenatal visits.
Relationship between socioeconomic status and number of prenatal visits
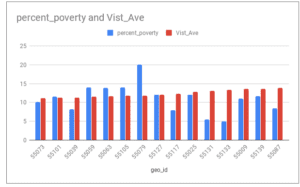
The aim of this section is to evaluate whether poverty impacts on the number of prenatal visits of the mother. It could assist in coming up with interventions to support mothers from low socioeconomic counties in financing prenatal visits. The query will compare the number of prenatal visits of the mothers from counties with low socioeconomic status against those with high socioeconomic status.
Question: Do mothers who come from counties with low socioeconomic counties have lower prenatal visits?
SQL Query:
WITH natality_2018 AS (
SELECT County_of_Residence_FIPS AS FIPS, Ave_Number_of_Prenatal_Wks AS Vist_Ave, County_of_Residence
FROM `bigquery-public-data.sdoh_cdc_wonder_natality.county_natality`
WHERE SUBSTR(County_of_Residence_FIPS,0,2) = “55” AND Year = ‘2018-01-01’
),
acs_2017 AS (
SELECT geo_id, poverty, total_pop
FROM `bigquery-public-data.census_bureau_acs.county_2017_5yr`
),
corr_tbl AS (
SELECT
acs_2017.geo_id, ROUND((poverty/total_pop)*100,2) AS percent_poverty, Vist_Ave, County_of_Residence
FROM acs_2017
JOIN natality_2018
ON acs_2017.geo_id = natality_2018.FIPS
ORDER BY Vist_Ave
)
SELECT * FROM corr_tbl
Graphical Results:
Results Link: https://docs.google.com/spreadsheets/d/19Fqy9BH-t3IMRhXrunAbdCzuibiuBVtIR1G73zLnyg4/edit#gid=26565258
The graphical results indicate no direct relationship between the socioeconomic status and the number of prenatal visits. Therefore, mothers from counties with low socioeconomic status do not have fewer prenatal visits. There may be other factors that influence the number of prenatal visits.
Relationship between commute time and prenatal visits
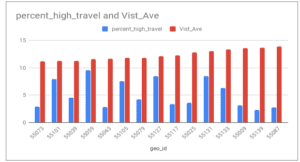
The aim of this section is to investigate whether commute time affects the number of prenatal visits. The results could be used in coming up with interventions to support mothers who spend a lot of time traveling to the facilities in facilitating transportation. The query compares the number of prenatal visits of mothers with high commute times against those who have fewer commute times.
Question: Do high commute times lead to a lower number of prenatal visits?
SQL Query:
Number-of-prenatal-visits AS (
SELECT County_of_Residence_FIPS AS FIPS, Ave_Number_of_Prenatal_Wks AS Vist_Ave, County_of_Residence
FROM `bigquery-public-data.sdoh_cdc_wonder_natality.county_natality`
WHERE SUBSTR(County_of_Residence_FIPS,0,2) = “55” AND Year = ‘2018-01-01’
),
High_travel_time AS (
SELECT geo_id, commute_45_59_mins AS high_travel_time, employed_pop
FROM `bigquery-public-data.census_bureau_acs.county_2017_5yr`
),
corr_tbl AS (
SELECT
acs_2017.geo_id, ROUND((high_travel_time/employed_pop)*100,2) AS percent_high_travel, Vist_Ave, County_of_Residence
FROM acs_2017
JOIN Number-of-prenatal-visits
ON High_travel_time.geo_id = natality_2018.FIPS
ORDER BY Vist_Ave
)
SELECT * FROM corr_tbl
Graphical Results
The graphical results reveal no direct relationship between travel time and prenatal visits. Therefore, high commute time does not lead to fewer prenatal visits.
Relationship between socioeconomic status and maternal morbidity
The aim of this section is to determine whether poverty leads to high morbidity rates. The query compares the morbidity rates among counties with lower socioeconomic status against those with high socioeconomic status. The results would assist in coming up with interventions to support mothers from lower socioeconomic counties.
Question: Is the rate of maternal morbidity high among the residents of lower socioeconomic counties?
SQL Query:
WITH morbidity_2018 AS (
SELECT County_of_Residence_FIPS AS FIPS, Births AS Morbidity_Births, County_of_Residence
FROM `bigquery-public-data.sdoh_cdc_wonder_natality.county_natality_by_maternal_morbidity`
WHERE Maternal_Morbidity_YN = 0 AND Year = ‘2018-01-01’
),
births_2018 AS (
SELECT County_of_Residence_FIPS AS FIPS, Births
FROM `bigquery-public-data.sdoh_cdc_wonder_natality.county_natality`
WHERE Year = ‘2018-01-01’
),
acs_2017 AS (
SELECT geo_id, poverty, total_pop
FROM `bigquery-public-data.census_bureau_acs.county_2017_5yr`
),
maternal_morbidity AS (
SELECT morbidity_2018.FIPS, ROUND((Morbidity_Births/Births)*100,2) AS Mbdy_pcnt, County_of_Residence
FROM morbidity_2018
JOIN births_2018
ON morbidity_2018.FIPS = births_2018.FIPS
),
corr_tbl AS (
SELECT
acs_2017.geo_id, ROUND((poverty/total_pop)*100,2) AS percent_poverty,
Mbdy_pcnt, County_of_Residence
FROM acs_2017
JOIN maternal_morbidity
ON acs_2017.geo_id =maternal_morbidity.FIPS
ORDER BY Mbdy_pcnt
)
SELECT * FROM corr_tbl
Graphical Results:
Results Link: https://docs.google.com/spreadsheets/d/1jBMXU_NeVScPV_RssYDSrrJXQ6Ya47C1JLpI6qCvNC0/edit#gid=266138378
The graphical results indicate no direct relationship between the rate of maternal morbidity and poverty levels. Therefore, maternal morbidity is not high among residents of lower socioeconomic counties.
Reference
Google Cloud Platform. Console.cloud.google.com. (2020). Retrieved 20 April 2020, from https://console.cloud.google.com/marketplace/details/center-disease-control/wonder-births?filter=solution-type:dataset&id=bf047c12-32b9-46dc-9a71-8154c44010cd.
ORDER A PLAGIARISM-FREE PAPER HERE
We’ll write everything from scratch
Question
For project two, identify one dataset you find interesting from the Google Big Query public datasets:
https://console.cloud.google.com/marketplace/browse?filter=solution-
Dataset- CDC Birth Data Summary
type:dataset&_ga=2.141314235.866765696.1585772756-831059195.1580368831 (Links to an external site.)
Come up with 3-5 questions that can be answered using the dataset, write down both the questions and your answers. Include a link to the dataset, your code and any graphics created.
The questions need SQL code to find the answers to questions in dataset.


