Week 5 Lab Assignment
Please use this template to help answer the questions listed in the lab instructions. The “steps” below refer to the steps listed in the lab instructions. Type your answers and post your screenshots in the spaces given below. Then, save this document with your name and submit it inside the course room.
Step 1. Gather Data
Your instructors will post 10 data values to use for this lab. The data values represent the HEIGHTS of 10 people from the same population in which you gathered your sample.
Please reach out to your instructor if you did not receive the assigned 10 data values for the term by Monday of Week 5.
(NOTE: This is NOT the data used in the lab video, which is about midterm grades. Do not use the midterm grades data.)
1a. Gather 10 MORE of your own to add to the 10 provided by your instructor. Do the following: Survey or measure 10 people to find their heights. For the remainder of this lab, treat the 20 numbers as ONE sample.
| Instructor Provided Heights | 62 | 62 | 62 | 63 | 65 | 67 | 68 | 69 | 69 | 73 |
| Gathered Heights | 68 | 73 | 71 | 71 | 64 | 61 | 68 | 65 | 66 | 72 |
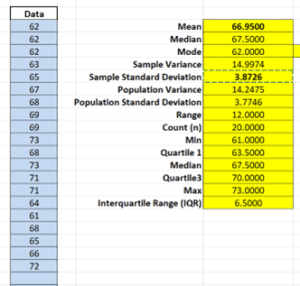
Determine the mean and standard deviation for the 20 values by using the Week 3 Excel spreadsheet. (Round statistics to two decimals.)
| Mean Height in Inches | 66.95 |
| Sample Standard Deviation in inches | 3.87 |
| Your Height in Inches | 71 |
1b. Post a screen shot in the space BELOW of the portion of the Week 3 spreadsheet that helped you determine these values. Please list the 10 heights your professor provided first followed by the 10 heights you collected. There should be 20 values to determine the mean and sample standard deviation.
1c. Answer the following two questions (Answer in complete sentences).
How does your height compare to the mean (average) height of the 20 values? Is your height taller, shorter, or the same as the mean of the sample?
My height is 4.05 inches taller than the mean of the sample.
Step 2. Data Characteristics
Answer the following questions to give some background information on the group of people you used in your study. Write in complete sentences.
- How did you choose the participants for your study? What was the sampling method: systematic, convenience, cluster, stratified, simple random, etc.? Explain how you concluded that you used the selected sampling method.
I asked my colleagues for their height. This was convenient since they’re aware that I’m in school.
- What part of the country did your study take place in?
Vero Beach, FL
- What are the age ranges of your participants?
23 – 57 years of age
- How many of each gender did you have in your study?
Male = 3 , Female = 7
- Identify the population based on the sample gathered. For example, if you sampled people that worked on your floor in the hospital, your population may be all employees at your hospital or if you sampled your neighbors, maybe the population is everyone who lives in your city.
Employees at my hospital
Step 3. Data Analysis
Answer the following questions. Use the Week 5 Excel spreadsheets to help analyze the data.
For the remainder of the lab, suppose the population has the same mean and standard deviation as your sample.
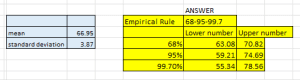
Empirical Rule
- Determine the 68%, 95%, and 99.7% values of the Empirical Rule using the population mean and standard deviation. (Use the Empirical Rule tab from the Week 5 spreadsheet).
68% values of Empirical Rule: [63.08, 70.82]
95% values of Empirical Rule: [59.21, 74.69]
99% values of Empirical Rule: [55.34, 78.56]
- Take a Screenshot of your Empirical Rule Sheet and provide it below.
- What do these values tell you? Write complete sentences explaining what the values in the Empirical Rule tell you in context of the data.
The Empirical Rule shows how the height data for 20 individuals is distributed around the mean of 66.95 inches. About 68% of the individuals have heights between 63.08 and 70.82 inches, representing the typical range. Approximately 95% of the individuals fall between 59.21 and 74.69 inches, covering most of the dataset. Almost all the data, 99.7%, falls between 55.34 and 78.56 inches, and any values outside this range are considered unusual or likely outliers.
Normal Distribution
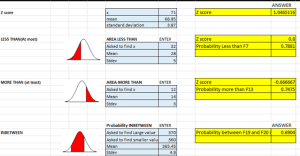
Use the Normal Probability Spreadsheet page to determine what percent of the population is shorter/taller than you.
- Based on your study results, what percent of the population are shorter than you? What percent are taller?
Based on my study results and the analysis from the Normal Probability Spreadsheet, approximately 78.81% of the population is shorter than me. This means that my height of 71 inches is greater than the height of about 4 out of 5 people in the population. Equally, around 21.19% of the population is taller than me. These percentages are derived from the normal distribution of heights in the population, assuming it follows the same mean (66.95 inches) and standard deviation (3.87 inches) as my sample. This analysis gives me a clear perspective on how my height compares to others in the studied population.
- Take a Screenshot of your Normal Probability Spreadsheet page and provide it below.
Step 4. Save and submit this document
Be sure your name is on the Word document, save it, and then submit it. In the assignment module, click “start assignment” and then “upload file” and “submit assignment”.
ORDER A PLAGIARISM-FREE PAPER HERE
We’ll write everything from scratch
Question 
Week 5 Lab Heights Provided by Instructor: Listed below
Heights (in)
- 62
- 62
- 62
- 63
- 65
- 67
- 68
- 69
- 69
- 73
Instructions
This week’s lab highlights using graphics, distributions, and tables to summarize and interpret data.
Prepare
Download the following documents from the Required Resources.
- Week 3 Excel spreadsheet
- Week 5 Excel spreadsheet
- Week 5 Lab Assignment Template

Week 5 Lab Assignment
Step 1: Gather Data
- Begin with 10 heights provided to you by your instructor. (Please reach out to your instructor by Monday in Week 5 if you have not received the 10 heights.)
- To add 10 more values to your lab data, survey or measure 10 people to find their heights. Add these heights to the Week 5 Lab Template along with the 10 provided by your instructor.
- Determine the mean and standard deviation for the 20 values (your instructor’s 10 from Step 1A above plus your 10) by using the Week 3 Excel Spreadsheet.
- Post a screenshot of the portion of the spreadsheet that helped you determine these values.
- How does your height compare to the mean (average) height of the 20 values? Is your height taller, shorter, or the same as the mean of the sample?
Step 2: Provide Background Information
- Give some background information on the group of people you used in your study. Use the following questions to guide your answers.
- How did you choose the participants for your study? What was the sampling method: systematic, convenience, cluster, stratified, simple random?
- What part of the country did your study take place in?
- What are the age ranges of your participants?
- How many of each gender did you have in your study?
- What are other interesting factors about your group?
Step 3: Use the Week 5 Excel Spreadsheet
- Use the Week 5 Excel Spreadsheet for the following:
- Use the Empirical Rule tab from the spreadsheet. Then, determine the 68%, 95%, and 99.7% values of the Empirical Rule in terms of the 20 heights in your height study.
- Post a screenshot of your work from the Week 5 Excel spreadsheet.
- What do these values tell you?
- Post another screenshot of your work from the Normal Probability tab from the Week 5 Excel spreadsheet.
- Based on your study results, what percent of the study participants are shorter than you? What percent are taller than you? (Example: If my height is 73 inches, then 20.86% of the relevant population is shorter. The other 79.14%, of course, is taller). *** My height is 71 inches***