Water Analysis Report
DOWSE Data
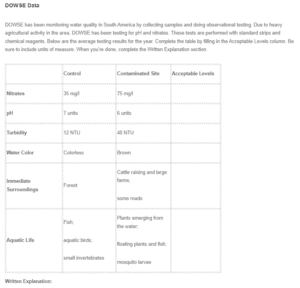
DOWSE has been monitoring water quality in South America by collecting samples and doing observational testing. Due to heavy agricultural activity in the area, DOWSE has been testing for pH and nitrates. These tests are performed with standard strips and chemical reagents. Below are the average testing results for the year. Complete the table by filling in the Acceptable Levels column. Be sure to include units of measure. When you’re done, complete the Written Explanation section.
| Control | Contaminated Site | Acceptable Levels | |
| Nitrates | 35 mg/l | 75 mg/l | 10 mg/l (nitrate – N)
45mg/l (nitrate) |
| pH | 7 units | 6 units | 6.5 to 8.5 units |
| Turbidity | 12 NTU | 40 NTU | <5 NTU |
| Water Color | Colorless | Brown | |
| Immediate Surroundings | Forest | Cattle raising and large farms;
some roads |
|
| Aquatic Life | Fish;
aquatic birds; small invertebrates |
Plants emerging from the water;
floating plants and fish; mosquito larvae |
Written Explanation:
To help develop the hypothesis, scientists based in the region conducted surveys with the residents. The residents were asked questions about their farming methods and their awareness of water pollution; then, the results were evaluated to develop the hypothesis. Additionally, general observations of the region by experts on environmental pollution also played a significant role in developing the hypothesis. The surveys and observations showed that the water sources were surrounded by large agricultural farms, which used many farming techniques that led to water pollution. Furthermore, the residents also conduct livestock farming.
Moreover, the water sources are near roads, which are always busy due to agricultural production; these factors contribute to water pollution. Farms produce waste products in large quantities. Such waste products include agrochemicals, drug residues, and organic matter. Animals can also cause water pollution if their wastes are poorly managed. Lastly, roads cause road run-off. Such water carries pollutants like plastics, pieces of metals, lead, spilt petroleum, or other substances that can be found on a dirt road. All these elements cause pollution in the water, and the results like those recorded in the tale above are evident.
Clean water is essential to animals and humans. Clean water is necessary for daily chores like bathing, cooking, cleaning the environment, and drinking. Additionally, clean water is also important for farms. Polluted water pollutes soils, which kills plants planted in them. Lastly, polluted water affects the ecosystem of the water, any living organisms in the water are killed, and any that survive can be harmful to people and animals in the surroundings.
Scientists collected water samples, which were later analyzed to determine the level of water quality indicators. The analysis was done on several factors, as shown in the table above. These factors were physical (water colour) and chemical (pH). The pH was tested using a pH meter, while the water turbidity test was done using a nephelometer. Also, the nitrate concentration and the water colour test were done using a spectrophotometer. Notably, the collected control samples were compared to the experimental samples to ensure accuracy.
The recommended pH level of water is 6.5 to 8.5 units; however, the water, in this case, was six units, which means that the water was too acidic. Secondly, the turbidity of the water was at 40 NTU, yet the recommended turbidity is below five NTU. This implies many organic materials and more loose soil sediments in the water sources. Lastly, the colour of the water was brown: clear water is the ultimate indication of clean water, and brown colour is an indication of dirt and pollution.
The results support the hypothesis that the agricultural farms, animals, and roads led to the pollution of the surrounding water bodies. The effects of acidic water are diverse. In farms, they include increased toxic elements in the soil and reduced rates of good nutrients (Driscoll et al., 2001). Acidic water can also corrode pipes, which causes metal poisoning when consumed by people or animals. Further, acidic water kills plants, fish, and other living organisms in the water. Essentially, turbidity measures how cloudy a water body is (Joniak et al., 2013). High cloudiness results from organic matter, and suspended and dissolved materials in the water, which in this case is a result of farm waste products that are drained into the river and road run-off.
Brown water bodies are light-limited (Ask 2012). This means that the very low light penetrates the waters, and any organism that cannot survive low light conditions will die. In addition, brown water bodies are an indication that the water is acidic. This information is important as it indicates the level of pollution that a water body is at. In my opinion, the DOWSE’S hypothesis is accurate because the results indicate this accuracy.
One of the effective methods to reduce water pollution is by establishing protection zones where the farms are close to the water bodies. In addition, farmers in the area need to be educated on the adverse effects of water pollution (Mateo-Sagasta et al., 2017). Lastly, buffer strips can also help filter pollutants before the drainage water pours into the water system, like a filtration system (Mateo-Sagasta et al., 2017).
References
Ask, J., Karlsson, J., & Jansson, M. (2012). Net ecosystem production in clear‐water and brown‐water lakes. Global Biogeochemical Cycles, 26(1).
Driscoll, C. T., Lawrence, G. B., Bulger, A. J., Butler, T. J., Cronan, C. S., Eagar, C., … & Weathers, K. C. (2001). Acidic Deposition in the Northeastern United States: Sources and Inputs, Ecosystem Effects, and Management Strategies: The effects of acidic deposition in the Northeastern United States include the acidification of soil and water, which stresses terrestrial and aquatic biota. BioScience, 51(3), 180-198.
Joniak, T., Jakubowska, N., & Szeląg-Wasielewska, E. (2013). Degradation of the recreational functions of urban lake: A preliminary evaluation of water turbidity and light availability (Strzeszyńskie Lake, Western Poland). Pol. J. Nat. Sci, 28(1), 43-51.
Mateo-Sagasta, J., Zadeh, S. M., Turral, H., & Burke, J. (2017). Water pollution from agriculture: a global review. Executive summary.
ORDER A PLAGIARISM-FREE PAPER HERE
We’ll write everything from scratch
Question 
Water Analysis Report
DOWSE Data
DOWSE has been monitoring water quality in South America by collecting samples and doing observational testing. Due to heavy agricultural activity in the area, DOWSE has been testing for pH and nitrates. These tests are performed with standard strips and chemical reagents. Below are the average testing results for the year. Complete the table by filling in the Acceptable Levels column. Be sure to include units of measure. When you’re done, complete the Written Explanation section.
| Control | Contaminated Site | Acceptable Levels | |
| Nitrates | 35 mg/l | 75 mg/l | |
| pH | 7 units | 6 units | |
| Turbidity | 12 NTU | 40 NTU | |
| Water Color | Colorless | Brown | |
| Immediate Surroundings | Forest | Cattle raising and large farms;
some roads |
|
| Aquatic Life | Fish;
aquatic birds; small invertebrates |
Plants emerging from the water;
floating plants and fish; mosquito larvae |
Written Explanation: