UNV 504 Excel Topic 3 Assignment
Garden Store
Hire our assignment writing services in case your assignment is devastating you. We offer assignment help with high professionalism.
| Product | Price per unit | Units sold | Total Unit Sales | |||
| Lawn mower | $ 230.27 | 179 | $ 41,218.33 | |||
| Rake | $ 17.90 | 413 | $ 7,392.70 | |||
| Shovel | $ 31.31 | 1423 | $ 44,554.13 | Total Sales | $ 225,249.46 | |
| Garden hose | $ 24.99 | 278 | $ 6,947.22 | |||
| Weed spray | $ 26.06 | 1025 | $ 26,711.50 | |||
| Hedge trimmers | $ 53.12 | 801 | $ 42,549.12 | |||
| Pruners | $ 28.44 | 630 | $ 17,917.20 | |||
| Sprinkler | $ 20.00 | 751 | $ 15,020.00 | |||
| Plastic bucket | $ 8.64 | 359 | $ 3,101.76 | |||
| Gloves | $ 7.50 | 2645 | $ 19,837.50 | |||
| Average | $ 44.82 | 850.4 | ||||
Symphony
| Instrument | Number of musicians | Instrument Family | Number of Musicians | |
| Violin | 32 | Brass | 18 | |
| Viola | 14 | Percussion | 17 | |
| Cello | 16 | Strings | 67 | |
| Double bass | 5 | Woodwinds | 18 | |
| Trumpet | 5 | |||
| Tuba | 4 | |||
| Trombone | 5 | |||
| French horn | 4 | |||
| Bassoon | 3 | |||
| Flute | 6 | |||
| Clarinet | 5 | |||
| Oboe | 4 | |||
| Percussion | 17 |
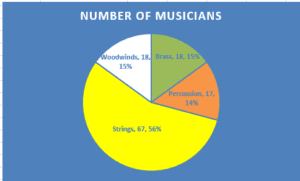
Number of Musicians
Division Sales
| Northwest Sales | 54 | 62 | 80 | 85 | 93 | 82 | 105 | 110 | 14 | 115 | 92 | 94 |
| Southwest Sales | 84 | 88 | 95 | 93 | 63 | 97 | 107 | 111 | 110 | 112 | 97 | 89 |
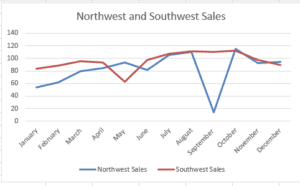
Northwest and Southwest Sales
Drinks
| Attendance | Soft Drinks Sold |
| 100 | 60 |
| 95 | 55 |
| 90 | 50 |
| 85 | 46 |
| 80 | 42 |
| 75 | 37 |
| 70 | 35 |
| 65 | 30 |
| 60 | 27 |
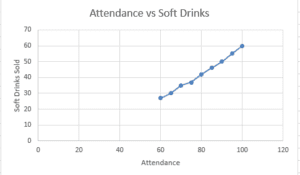
Attendance vs Soft Drinks
Last
| The most challenging part of this assignment | After Hiding cells when drawing a chart, unhiding the cells includes the data for the hidden cells in the chart, which disrupts the chart. To draw a chart using a sub-set of data, copy and paste the data subsets in other cells, then highlight to generate a chart. | ||||||||||||||||||||||||
ORDER A PLAGIARISM-FREE PAPER HERE
We’ll write everything from scratch
Question 
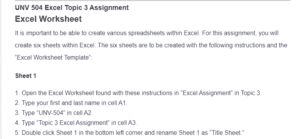
UNV 504 Excel Topic 3 Assignment
Excel Worksheet
It is important to be able to create various spreadsheets within Excel. For this assignment, you will create six sheets within Excel. The six sheets are to be created with the following instructions and the “Excel Worksheet Template”:
UNV 504 Excel Topic 3 Assignment
Sheet 1
- Open the Excel Worksheet found with these instructions in “Excel Assignment” in Topic 3.
- Type your first and last name in cell A1.
- Type “UNV-504” in cell A2.
- Type “Topic 3 Excel Assignment” in cell A3.
- Double click Sheet 1 in the bottom left corner and rename Sheet 1 as “Title Sheet.”
Sheet 2 (Review “Excel 2010 Tutorial for Beginners #3 – Calculation Basics & Formulas” and “Excel 2010: Basic Functions”)
- Open Sheet 2 by clicking the Sheet 2 tab at the bottom of the Excel Workbook.
- In cell D1, type “Total Unit Sales.”
- Using the basic calculation functionality of Excel, find the total unit sales (Price per Unit times the Units Sold) for each product. Do not use a separate calculator to find the results. Include the result in column D.
- Type “Average” in cell A12.
- In cell B12, insert a function to find the average price per unit.
- In cell C12, insert a function to find the average number of units sold.
- Change the price per unit of weed spray to $26.06.
- Change the plastic buckets units sold to 359.
- Type Total Sales in cell F4.
- Insert a function in cell G4 for the sum of all Total Unit Sales.
- Rename Sheet 2 “Garden Store.”
Sheet 3 (Review “Excel 2010 Tutorial for Beginners #11 – Charts Pt.2 Pie Chart”)
- Create a pie chart using the data in columns D and E.
- Add data labels so that each slice of the pie shows the corresponding percentage and instrument family.
- Rename Sheet 3 “Symphony.”
Sheet 4 (Review “Creating a Line Graph in Microsoft Excel”)
- Create a line graph for Northeast Sales and Southeast Sales using the data provided.
- Create a second line graph for Northwest Sales and Southwest Sales using the data provided.
- Rename Sheet 4 “Division Sales.”
Sheet 5 (Review “Create an X Y Scatter Chart”)
- Create a scatterplot using the data provided.
- Label the X-Axis “Attendance” and the Y-Axis “Soft Drink Sold.”
- Label Sheet 5 “Drinks.”
Sheet 6 (Review “Adding or Renaming a Worksheet in Excel 2010”)
- Create a new tab.
- In cell A1, type the most challenging part of this assignment.
- In cell A2, write something new that you learned.
- Label Sheet 6 “Last.”
- Save the Excel Worksheet and submit in LoudCloud.