Strategic Plan for Implementing Innovation in the Automobile and Truck Industry
The competitors’ relative strengths in the marketplace
The market owned by each competitor
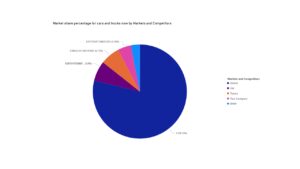
Figure 1
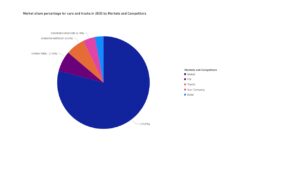
Figure 2
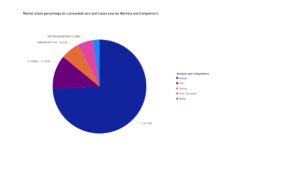
Figure 3
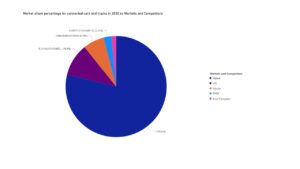
Figure 4
Market Share Percentage for Automobiles and Trucks
- Figures 1 and 2 represent the changes in market share percentage for automobiles and trucks between 2021 and 2030.
- The data indicates that our mart share will decrease from 4.56% to 4.18%.
- Toyota’s market share will decrease from 6.72% to 6.65%.
- BMW’s market share will decrease from 3.08% to 2.98%.
- Volkswagen’s market share will increase from 6.9% to 7.12%.
Market Share Percentage for Connected Automobiles and Trucks
- Figures 3 and 4 represent the trend in market share proportion for connected automobiles and trucks between 2021 and 2030.
- The data indicates that our company’s market share will decrease from 5.28% to 2.42%.
- BMW’s market share will decrease from 2.23% to 1.57%.
- Volkswagen’s market share will decrease from 11.52% to 10.4%.
- Toyota’s market share will increase from 6.62% to 6.79%.
The Growth Rate of Each Competitor
BMW, Volkswagen, and Toyota have been experiencing rapid growth based on their revenue and market share data. In 2020, BMW had $126.10 billion in annual revenue. The revenue is expected to increase to $181.5 billion by 2030.BMW is also estimated to increase its market share for connected automobiles and trucks from 3.00 % to 3.07% by 2030. However, the company’s market share for ordinary cars is expected to decrease from the current 3.91% to 3.77% by 2030. Toyota’s annual revenue in 2020 was $275.40 billion. The company estimates that the revenue will increase to $404.5 billion by 2030. However, Toyota’s connected and ordinary automobiles and trucks market share is expected to reduce from 8.90% to 8.62% for connected vehicles and 8.53% to 8.41% for regular vehicles by 2030. Volkswagen’s revenue in 2020 was $282.90 billion. The market share for typical automobiles and trucks is estimated to rise from 8.76% to 9.00% by 2030. However, the company’s market share for connected automobiles and trucks is expected to decrease from the current 15.50% to 13.19% by 2030.
Each Competitor’s Financial Strength
The comparative operating data indicates that among the three competitors, Volkswagen generated the most revenue in 2020. Revenue is one of the indicators of financial strength because a high revenue suggests that a company is growing financially. Based on the comparative data, Toyota generated $275.4 billion in revenue in 2020 and a $19.7 billion net income. Volkswagen generated $282.9% billion in revenue in 2020 and $16.1 billion in net income.BMW generated the least revenue amounting to $126.1 billion and $6.1 billion in net income. The data leads to the conclusion that Volkswagen has the highest financial strength, followed by Toyota, and BMW has the least financial strength.
Our Market Share Compared to Our Competitors
Our Company’s Market Share Trend
Comparative data on our company’s market share indicates that we are currently losing the market share. Our current market share in regular automobiles and trucks is 4.56 % and will be 4.18% in 2030. This indicates that there will be a drop of 0.38% in the market share. The present market share for connected automobiles and trucks is 5.28 % and will be 2.24% in 2030, thus indicating a drop by 3.04%. One of the factors that could cause the decline in market share is increased competition from Volkswagen and Toyota. The comparative data indicates that Volkswagen’s market share for regular cars will increase from 6.9% to 7.12% by 2030. Toyota’s market share for connected automobiles and trucks will increase from the current 6.62% to 6.79% by 2030. Volkswagen will, therefore, have the largest market share for ordinary automobiles and trucks by 2030, while Toyota will have the largest market share for connected automobiles and trucks. The second factor behind the loss in our company’s market share is changes in customer preference. Our customers may prefer our competitor’s cars because they have already established solid brand equity and customer loyalty, prompting them to try out their new vehicles with improved features.
Our Company’s Growth Potential in The Industry
Our company has a limited growth prospect due to stiff competition from Volkswagen and Toyota. However, we can secure a reasonable market share and focus on building customer loyalty by constantly improving the quality of our vehicles and trucks. We can also achieve significant growth by lowering our prices until our vehicles gain recognition in the market. According to Hennecke (2019), this strategy, referred to as penetration pricing, is effective when introducing a product in a highly competitive market. We will use penetration pricing to build our market share and establish a solid customer base before increasing the prices based on the market price for similar automobiles and trucks.
Our Company’s Financials Compared to Our Competitors
Our financials are relatively low compared to Volkswagen’s and Toyota’s but better than BMW’s. This conclusion is based on the revenue generated by each competitor and their estimated revenues by 2030. Toyota’s 2020 revenue for ordinary automobiles and trucks was $282.9 billion and is estimated to increase to $404.5 billion by 2030. The projected revenue for connected automobiles and trucks by 2030 is $43.97 billion. Volkswagen’s revenue for ordinary automobiles and trucks in 2020 was $282.90 billion and is expected to rise to $433.1 billion by 2030. The revenue for connected automobiles and trucks is estimated to be $67.30 billion by 2030.BMW’s revenue for ordinary cars in 2020 was $126.10 billion and is estimated to rise to $181.5 billion by 2030. The company’s revenue for connected vehicles and trucks is estimated to reach $67.30 billion by 2030.
Future Potential Total Available Market (TAM) and Growth For Each Chosen Product/Service and Technology
The TAM For Cars and Light Trucks
Our company’s TAM for automobiles and trucks is $187.10 billion. However, the future potential of TAM will be high based on the fact that the market share is expected to rise to 5.28% by 2030. The growth rate is favorable compared to competitors because Toyota’s estimated market share within the next ten years is 8.41%, BMW’s is 3.77%, and Volkswagen’s is 9.00%.
The TAM for IoT-Connected Cars and Light Trucks
Our company’s TAM for connected automobiles and light trucks is $3.83 billion. Our competitor’s TAM ranges between $1 and $8 billion. For instance, Toyota’s, BMW’s, and Volkswagen’s TAM are $4.80, $1.62, and $8.36 billion in that order.
The Projected Compound Annual Growth Rate (CAGR) For Cars And Light Trucks
Our company’s estimated CAGR for automobiles and light trucks is 3.10% within the next ten years.BMW’s CAGR is estimated to be 3.70%, while Toyota’s and Volkswagen’s CAGR is estimated to be 3.90% and 4.30%respectively within the same timeline.
The Projected CAGR for IoT-Connected Cars and Light Trucks
Our company’s estimated CAGR for connected automobiles and light trucks is 10.20% within the next ten years. Our competitor’s CAGR within the same timeline is slightly higher because BMW, Toyota, and Volkswagen have an estimated CAGR of 25.50%,24.80%, and 23.20%, respectively.
The Fastest-Growing Competitor
Volkswagen is growing faster compared to other competitors because its current revenue for ordinary automobiles and trucks is $282.90 billion. The estimated revenue within the next ten years is $433.1 billion, and Volkswagen’s current connected cars’ revenue is $8.36 billion and is estimated to be $67.30 by 2030.
Ways to Adjust if Business Conditions Change
What to do if your customers are slow to respond (buy) the innovation
The acceptability of innovation may take time as customers may be reluctant to buy it, especially if they do not understand how it works (Planing, 2014). If our customers respond slowly to the innovation, the first measure that we will take is training them on how the innovation works. We will create short videos demonstrating the new innovative features and how they contribute to improving the safety and efficiency of our vehicles. The videos will be posted on different social media platforms to reach as many customers as possible. The second measure will be using customer testimonials to convince customers that our innovative vehicles are safe and efficient.
What to do if one competitor is overtaking all the others, including your company
According to (Mishra 2017), creating a competitive advantage requires focusing on aspects that make a product better than what is being offered by competitors. Therefore, if one competitor is overtaking other competitors and us, we will focus on improving the quality of our vehicles and reducing our prices. We will also provide after-sale services such as maintenance and delivery to attract more customers.
The Steps Our Company Needs to Take From Concept Outline to Launch
The size of development that will be required
We will require a large development to assemble all the parts needed to add new features to our current collection of automobiles. The development will also be large enough to support mass manufacturing to meet demand. The development will be divided into two sections which will be the manufacturing and testing section to ensure that the vehicles are safe before being launched and distributed in the market.
Additional capital and personnel
We will need additional capital to purchase the computer systems required to add the innovative features to our vehicles. The additional capital will also be used to train the existing workforce and equip them with the skills needed to manufacture IoT-connected vehicles.
How we would approach determining the timeline from the beginning of development until the initial product launch
We will use benchmarking to determine the timeline from the initial development stage to the product launch. According to Anand & Kodali (2008) can be done through observation or interviews. We will interview manufacturers currently manufacturing similar vehicles to determine how much time they take and the number of workers required to complete the manufacturing process within their timeline.
References
Anand, G., & Kodali, R. (2008). Benchmarking the benchmarking models. Benchmarking: An International Journal, 15(3), 257-291. https://doi.org/10.1108/14635770810876593
Hennecke, I. (2019). Implementing a structured pricing strategy approach. Pricing Strategy Implementation, 92-99. https://doi.org/10.4324/9780429446849-10
Mishra, C. S. (2017). Competitive advantage logic. Creating and Sustaining Competitive Advantage, 3-34. https://doi.org/10.1007/978-3-319-54540-0_1
Planing, P. (2014). Innovation acceptance: The case of advanced driver-assistance systems. Springer Gabler.
ORDER A PLAGIARISM-FREE PAPER HERE
We’ll write everything from scratch
Question
Overview
Using the recommendation that you provided in Milestone One, you will develop a strategy to implement the innovation and get ahead in the marketplace.
Strategic Plan for Implementing Innovation in the Automobile and Truck Industry
Scenario
You work as a middle manager for one of the top U.S. producers of luxury and mass-market automobiles and trucks. You are now leading a cross-functional team to move forward with the company initiative. To remain a viable competitor and meet the demands of consumers’ desire for technology, the company’s chief technology officer (CTO) has decided to implement the Internet of Things (IoT) into its product line.
In Milestone One, you and your cross-functional team looked at the risks and benefits of each innovation option, competitors in the market, and the company’s internal capability for moving forward with the innovation. After doing this analysis, you presented your recommendation to various stakeholders about how to proceed. You chose one of the following:
Design a completely new product line based on recent technology (discontinuous innovation)
or
Add recent technology features into one model and then incrementally into the broader product line (incremental innovation)
The CTO has accepted your recommendation. Now you are ready to develop a strategy for taking the innovation to market. In order to develop a strategy, you will need to look at your competitors’ relative strengths in the current marketplace to understand how the company compares to your competitors and to identify the total market and the market’s annual growth rate. Finally, you also need to share your thoughts on how to respond to changes in business conditions. Although no one can predict what is going to happen, it is important to think about how flexible your plan is in order to meet unexpected conditions.
Prompt
Using the recommendation you provided in Milestone One, develop a strategic plan to implement the innovation and gain a competitive advantage. Use the Sales Forecast, Comparative Growth Data, and Comparative Operating Statistics to complete this milestone.
Strategic Plan
Analyze the competitors’ relative strengths in the marketplace.
Write a short paragraph describing the growth rate of each competitor. You will get the solution from the comparative growth data sheet.
How much of the market does each competitor now own? Do you see a trend of gaining or losing market share? Present your findings using Power BI.
Perform your analysis for the cars and trucks category. Create pie charts using columns C and F from the comparative growth Excel sheet in Power BI.
Perform your analysis for the connected cars and trucks category. Create pie charts using columns H and K from the comparative growth Excel sheet in Power BI.
Determine each competitor’s financial strength by looking at their comparative operating data.
Explain how your company’s market share compares to your competitors.
Is your company gaining or losing market share? Expand on the analysis done in Task 1 above and explain the major factors behind the change in market share.
What is your company’s growth potential in the industry?
How do your company’s financials look compared to those of your competitors?
Identify future potential total available market (TAM) and growth for each chosen product/service and technology.
What is the TAM for cars and light trucks?
What is the TAM for IoT-connected cars and light trucks?
What is the projected compound annual growth rate (CAGR) for cars and light trucks?
What is the projected CAGR for IoT-connected cars and light trucks?
Identify the fastest-growing competitor.
Identify ways to adjust if business conditions change.
What can you do if your customers are slow to respond (buy) the innovation?
What can you do if one competitor is overtaking all the others, including your company?
Describe the steps your company needs to take from concept outline to launch. Consider what you learned from the previous two modules to ensure the steps are easy for your team to understand.
What size of development will be required?
Will you require additional capital and personnel?
How would you approach determining the timeline from the beginning of development until the initial product launch?

