Statistical Significance
Statistical significance is an important aspect of statistical analysis and results interpretation. Statistical significance enables the researcher to determine whether the findings from a research study are meaningful or not. According to Field (2018), statistical significance tells the researcher whether the statistics from a sample can be a true representation of population characteristics. Other researchers, such as Rosnow and Rosenthal (2013), have used statistical significance to indicate that the findings from a study are unlikely to fall under the null hypothesis of a statistical test. Statistical significance is expressed as a value between 0 and 1, the range for a p-value.
P-value (probability value) tells us the probability of the data occurring by random chance, or the likelihood that the null hypothesis is true (Rosnow & Rosenthal, 2013). Therefore, the smaller the p-value, the stronger the evidence that we should reject the null hypothesis and the greater the evidence that the null hypothesis is not true.
In the hypothetical research where the researcher wants to test the memory performance of two groups, one group consumes a caffeinated coffee, while the other group consumes a non-caffeinated coffee. The null and alternative hypotheses in the research would be;
- Null hypothesis: There is no significant difference between the two groups on test performance.
- Alternative hypothesis: There is a significant difference between the two groups on test performance.
When the researcher says that the results are statistically significant, it implies that there is minimal chance that the data falls under the null hypothesis. This is evident from the reported p-value (p<0.05), which means that the difference in test performance between the two groups is significant, as shown by mean performances. From the findings, it is justifiable to conclude that caffeine reduces memory performance.
References
Field, A. (2018). Discovering Statistics Using IBM SPSS Statistics. (5th Ed.) London: SAGE Publications.
Rosnow, R. L., & Rosenthal, R. (2013). Beginning Behavioral Research: A Conceptual Primer. (7th Ed.) Pearson Education, Inc.
ORDER A PLAGIARISM-FREE PAPER HERE
We’ll write everything from scratch
Question
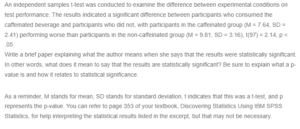
An independent samples t-test was conducted to examine the difference between experimental conditions on test performance. The results indicated a significant difference between participants who consumed the caffeinated beverage and participants who did not, with participants in the caffeinated group (M = 7.64, SD = 2.41) performing worse than participants in the non-caffeinated group (M = 9.81, SD = 3.16), t(97) = 2.14, p < .05.

Statistical Significance
Write a brief paper explaining what the author means when she says that the results were statistically significant. In other words, what does it mean to say that the results are statistically significant? Be sure to explain what a p-value is and how it relates to statistical significance.
As a reminder, M stands for mean, SD stands for standard deviation, t indicates that this was a t-test, and p represents the p-value. You can refer to page 353 of your textbook, Discovering Statistics Using IBM SPSS Statistics, for help interpreting the statistical results listed in the excerpt, but that may not be necessary.
Required Resources
Textbook: Beginning Behavioral Research: A Conceptual Primer, Chapter 12
This chapter is a discussion on the logic of hypothesis testing and related topics such as p values, decision errors, and effect sizes (Note: This chapter reading should be a review since you already read it in PSY 510).

