Simple Regression Model
- Floor Area and Assessment Value Scatter Plot
There is a linear relationship between Floor Area and Assessment Value. The trend line and the regression equation indicate a positive linear relationship between the two variables (Rubinson, 2019). Hire our assignment writing services in case your assignment is devastating you.
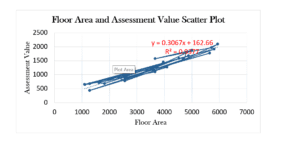
Floor Area and Assessment Value Scatter Plot
- Whether Floor Area a significant predictor of Assessment Value
| SUMMARY OUTPUT | |
| Regression Statistics | |
| Multiple R | 0.968358 |
| R Square | 0.937718 |
| Adjusted R Square | 0.935642 |
| Standard Error | 115.5993 |
| Observations | 32 |
| ANOVA | ||||||||
| df | SS | MS | F | Significance F | ||||
| Regression | 1 | 6035852 | 6035852 | 451.6772 | 1.23E-19 | |||
| Residual | 30 | 400896 | 13363.2 | |||||
| Total | 31 | 6436748 | ||||||
| Coefficients | Standard Error | t Stat | P-value | Lower 95% | Upper 95% | Lower 95.0% | Upper 95.0% | |
| Intercept | 162.6628 | 54.47857 | 2.985812 | 0.005586 | 51.40269 | 273.9228 | 51.40269 | 273.9228 |
| X Variable 1 | 0.306732 | 0.014433 | 21.2527 | 1.23E-19 | 0.277257 | 0.336207 | 0.277257 | 0.336207 |
Based on the regression analysis output of Floor Area and Assessment Value, the P-Value obtained (0.005586) is less than 0.05, which implies that the Floor Area significantly predicts Assessment Value.
- Age and Assessment Value Scatter Plot
The regression equation obtained shows no linear relationship between Age and Assessment Value.
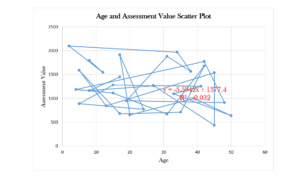
Age and Assessment Value Scatter Plot
- Regression Analysis of Age and Assessment Value
| SUMMARY OUTPUT | |
| Regression Statistics | |
| Multiple R | 0.179004 |
| R Square | 0.032043 |
| Adjusted R Square | -0.00022 |
| Standard Error | 455.7228 |
| Observations | 32 |
| ANOVA | ||||||||
| Df | SS | MS | F | Significance F | ||||
| Regression | 1 | 206249.6 | 206249.6 | 0.993097 | 0.326957 | |||
| Residual | 30 | 6230498 | 207683.3 | |||||
| Total | 31 | 6436748 | ||||||
| Coefficients | Standard Error | t Stat | P-value | Lower 95% | Upper 95% | Lower 95.0% | Upper 95.0% | |
| Intercept | 1377.366 | 163.1906 | 8.440231 | 2.03E-09 | 1044.086 | 1710.646 | 1044.086 | 1710.646 |
| X Variable 1 | -5.59421 | 5.613615 | -0.99654 | 0.326957 | -17.0587 | 5.870325 | -17.0587 | 5.870325 |
From the regression output, the P-value indicates that age significantly predicts the Assessment Value. However, due to the small R-squared value and the lack of linear relationship, age gives very minimal information about assessment value (Field, 2018).
- Multiple Regression Model for Assessment Value as the dependent variable and Floor Area, Offices, Entrances, and Age as independent variables.
| SUMMARY OUTPUT | |
| Regression Statistics | |
| Multiple R | 0.976236 |
| R Square | 0.953037 |
| Adjusted R Square | 0.946079 |
| Standard Error | 105.8108 |
| Observations | 32 |
The Overall R Square is 0.976236, while the Adjusted R Square is 0.946079
| ANOVA | ||||||||
| Df | SS | MS | F | Significance F | ||||
| Regression | 4 | 6134458 | 1533615 | 136.9798 | 1.62E-17 | |||
| Residual | 27 | 302289.8 | 11195.92 | |||||
| Total | 31 | 6436748 | ||||||
| Coefficients | Standard Error | t Stat | P-value | Lower 95% | Upper 95% | Lower 95.0% | Upper 95.0% | |
| Intercept | 38.78345 | 77.09451 | 0.503064 | 0.618999 | -119.401 | 196.9683 | -119.401 | 196.9683 |
| Floor Area (Sq. Ft.) | 0.244041 | 0.025492 | 9.573045 | 3.59E-10 | 0.191735 | 0.296347 | 0.191735 | 0.296347 |
| Offices | 80.94592 | 35.65398 | 2.27032 | 0.031382 | 7.790001 | 154.1018 | 7.790001 | 154.1018 |
| Entrances | 86.59756 | 45.20452 | 1.915683 | 0.066051 | -6.15446 | 179.3496 | -6.15446 | 179.3496 |
| Age | -0.20799 | 1.406374 | -0.14789 | 0.883528 | -3.09363 | 2.677652 | -3.09363 | 2.677652 |
Working with α=0.05, the predictors that can be regarded as significant predictors from the analysis output are the variables with a P-value less than .05. Therefore, the significant predictors are Floor Area and Offices with P-values of 3.59E-10 and 031382, respectively.
We can eliminate Age and Entrances since their P-values are greater than .05, which cannot be regarded as significant predictors.
To Obtain the Final model Using Floor Area and Offices as the predictors, we can generate another regression output with the two variables as shown below;
| SUMMARY OUTPUT | |
| Regression Statistics | |
| Multiple R | 0.972788 |
| R Square | 0.946317 |
| Adjusted R Square | 0.942615 |
| Standard Error | 109.1571 |
| Observations | 32 |
| ANOVA | ||||||||
| Df | SS | MS | F | Significance F | ||||
| Regression | 2 | 6091205 | 3045603 | 255.605 | 3.82E-19 | |||
| Residual | 29 | 345542.9 | 11915.27 | |||||
| Total | 31 | 6436748 | ||||||
| Coefficients | Standard Error | t Stat | P-value | Lower 95% | Upper 95% | Lower 95.0% | Upper 95.0% | |
| Intercept | 115.9136 | 55.82814 | 2.076257 | 0.04684 | 1.732186 | 230.0949 | 1.732186 | 230.0949 |
| Floor Area (sq. Ft.) | 0.264121 | 0.024012 | 10.99955 | 7.28E-12 | 0.215011 | 0.313231 | 0.215011 | 0.313231 |
| Offices | 78.33906 | 36.34622 | 2.155356 | 0.039569 | 4.002689 | 152.6754 | 4.002689 | 152.6754 |
Model: Y= 115.9136 + 0.264121X1 + 78.33906X2
Where Y= Assessed Value
X1 = Floor Area
X2 = Offices
Supposing our final model is:
Assessed Value = 115.9 + 0.26 x Floor Area + 78.34 x Offices; what would be the assessed value of a medical office building with a floor area of 3500 sq. ft., 2 offices, that was built 15 years ago? Is this assessed value consistent with what appears in the database?
By substituting the values in the model, we obtain;
Assessed Value = 115.9 + (0.26 x 3500) + (78.34 x 2)
= $1,182,580
Substituting the Floor Area and Offices values in the model for a building that was built 15 years ago, the outcome matches the value in the database, which implies the model is accurate.
References
Field, A. (2018) Discovering Statistics Using IBM SPSS Statistics, Sage Publishers, California.
Rubinson, C. (2019). Presenting Qualitative Comparative Analysis: Notation, Tabular Layout, And Visualization. Methodological Innovations, 12(2), 205979911986211. doi: 10.1177/2059799119862110
ORDER A PLAGIARISM-FREE PAPER HERE
We’ll write everything from scratch
Question 
Week 5 Simple Regression Model Spreadsheet
Assignment Content
Purpose
This assignment provides an opportunity to develop, evaluate, and apply bivariate and multivariate linear regression models.
Simple Regression Model
Resources: Microsoft Excel®, DAT565_v3_Wk5_Data_File (See attached)
Instructions:
The Excel file for this assignment contains a database with information about the tax assessment value assigned to medical office buildings in a city. The following is a list of the variables in the database:
- FloorArea: square feet of floor space
- Offices: number of offices in the building
- Entrances: number of customer entrances
- Age: age of the building (years)
- AssessedValue: tax assessment value (thousands of dollars)
Use the data to construct a model that predicts the tax assessment value assigned to medical office buildings with specific characteristics.
- Construct a scatter plot in Excel with FloorArea as the independent variable and AssessmentValue as the dependent variable. Insert the bivariate linear regression equation and r^2 in your graph. Do you observe a linear relationship between the 2 variables?
- Use Excel’s Analysis ToolPak to conduct a regression analysis of FloorArea and AssessmentValue. Is FloorArea a significant predictor of AssessmentValue?
- Construct a scatter plot in Excel with Age as the independent variable and AssessmentValue as the dependent variable. Insert the bivariate linear regression equation and r^2 in your graph. Do you observe a linear relationship between the 2 variables?
- Use Excel’s Analysis ToolPak to conduct a regression analysis of Age and Assessment Value. Is age a significant predictor of AssessmentValue?
Construct a multiple regression model.
- Use Excel’s Analysis ToolPak to conduct a regression analysis with AssessmentValue as the dependent variable and FloorArea, Offices, Entrances, and Age as independent variables. What is the overall fit r^2? What is the adjusted r^2?
- Which predictors are considered significant if we work with α=0.05? Which predictors can be eliminated?
- What is the final model if we only use FloorArea and Offices as predictors?
- Suppose our final model is:
- AssessedValue = 115.9 + 0.26 x FloorArea + 78.34 x Offices
- What would be the assessed value of a medical office building with a floor area of 3500 sq. ft., 2 offices, that was built 15 years ago? Is this assessed value consistent with what appears in the database?