Process Improvement Flowchart
Process Evaluation
Backwood Farms has been a family-owned and operated meat goat operation since 1994. We specialize in producing market-ready meat goats as well as registered seed stock. We have successfully gotten kids on the ground throughout the years but have fallen behind the industry average for weaning weight. Our product must grow fast and efficiently selling seed stock, which is becoming an increasing goal of the operation. Usually, our process is very hands-off, with limited inputs resulting in slower-growing kids, longer marketing times, and increased mortality. Kids are raised on pasture with their dams, receive grain daily, and are vaccinated at weaning. Animals were often marketed prematurely to meet consumer demands or kept growing, and marketing opportunities were missed.
Our process needs updating, especially as our goals and customer base change.
Process evaluation identifies inefficiencies and sheds light on a solution using the 5 LEAN concepts; value, value stream, flow, pull, and perfection (Crawford, 2022). As our customers’ values change, our process must change to meet their demands. We must design a value stream that is efficient and adds value, a flow that is timely, moving stock from birth to market quickly to have animals ready when customers demand them. Do you need help with your assignment ? Hire our assignment writing services in case your assignment is devastating you.
Evaluation of Control Chart and Process Metrics
Using data from our spring 2021 kidding, an average daily gain (ADG) was computed (weaning weight-birthweight/ 75 days). Once ADG was recorded, a mean and standard deviation, or σᶺ, was determined. Those figures helped determine the USL and LSL. The processing capability was determined to be 1 (Cp=USL-LSL/6σᶺ). The chart below allows us a graphical representation to evaluate our process.
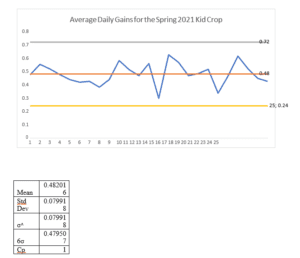
Using Statistical Process Control, we can measure the outcome variable of the process to determine the capability. In this instance, the process capability is perfectly centered at 1. There are some natural variations in the average daily gains of the kids, but the majority of kids stay near the average. In looking at the outliers, environmental variables can be attributed to the extreme differences: litter size (single, twins, triplets) affected ADG and animals that dealt with coccidia. To avoid the number of outliers, it will be essential to improve the process by managing the health of every kid’s health and developing protocols to handle larger litter sizes.
This process could undoubtedly use the concepts of Six Sigma, which would tighten the margin of ADG and allow a more uniform product.
Executive Summary
Backwood Farms is a small, family-owned operation producing meat goats since the mid-1990s. Initially, the operation aimed to produce the maximum pounds of goat kids with the least amount of inputs. However, over the last few years, the operational goals have changed to produce high-quality registered seed stock. With the shift in goals comes the shift in customer demands and values and the inherent need to adjust the production process. The need to produce fast-growing kids that wean heavily is essential to meet the consumer’s demands. A recommendation and strategy will be formed using process evaluation and metrics to realign processes to customer values.
Process Evaluation
Our process for raising kids has been designed around low inputs. Our female kids are in kidding stalls, and the new families receive special care and any intervention needed for the first three days. On the 3rd day, the new family is put into a pasture with others to survive and raise their offspring for 75 days or until weaning. The ideal market weight for these goats is between 60 and 80 pounds; our weaning weights would range between 35 and 45 pounds and result in the marketing of these prematurely at a lesser weight or time, and resources were put into them to market when they reached market weight, which many times were after peak price season. With our goals shifted, using LEAN to evaluate and improve our process identifies inefficiencies and suggests opportunities to align the process with consumer values.
Consumers demand fast-growing kids with weaning weights above 60 pounds. Changing our production process to meet this metric will make the kid crop marketable at weaning, using fewer resources and increasing profitability. To meet these metrics, the new process must pay close attention to a feeding program, a management plan for pregnant does, and a health protocol for all kids. Even with improved processes, environmental variables will be hard to control.
Evaluation of The Control Chart
| Mean | 44.2 |
| Std Dev | 6.757712 |
| σᶺ | 6.757712 |
| 6σ | 40.54627 |
| Cp | 1 |
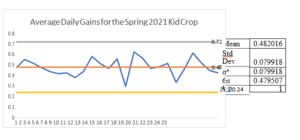
Looking at the Control Chart for the ADG of the 2021 spring kid crop allows us to glimpse the production process.
At first glance, there is no glaring issue, as the gain rate for most kids was near the median, which is reinforced by the perfectly centered process capacity. There are a few outliers to
notice, and once digging deeper into the data, those abnormalities are indeed caused by environmental variables, as the two lowest performers
come from larger litter sizes and are noted as unthrifty as they dealt with coccidia. At the same time, the overachievers were singles kids on dams that were noted as heavy milkers.
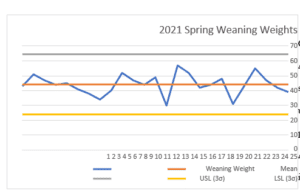
Even when evaluating weaning weights, the process capability is still one, and things appear centered. However, in evaluating the new goals and values, the current process misses the metrics determined by the new consumer demands by 15.8 pounds on average. The difference between the new goals and current performance is attributed to these assignable causes; Adult and kid nutrition, pregnancy management, and kid health protocols.
LEAN and Six Sigma
The process can benefit by using LEAN and Six Sigma. In designing the new processes, it is important to be centered around the customer value, develop protocols that add value with each step, create a timely flow, and produce products in time for the consumer demand. Six Sigma’s concepts are designed to keep products consistent, efficient, and uniform by lowering the variation in production. Those principles are essential whether you are selling tablets or producing livestock and will be embedded in the decision-making culture at Backwood Farms.
Recommendations
To maintain desired outcomes, environmental variables must be addressed continuously, and a control chart will be monitored weekly to adjust management decisions in the barn. Control charts need to be analyzed to be more uniform and closer to Sigma Six and augmented charts on ADG and current weights with the LSL as benchmarks for growth. Keeping accurate data will improve quality and efficiency, allow for informed decision-making as the farm transitions to a new audience, and focus on creating a new production process rooted in the value chain, efficiency, and uniformity.
References
Crawford, M. (2022). 5 Lean Principles Every Engineer Should Know. Asme.org. They were retrieved on 5 February 2022 from https://www.asme.org/topics-resources/content/5-lean-principles-every- should-know.
ORDER A PLAGIARISM-FREE PAPER HERE
We’ll write everything from scratch
Question 
This assignment aims to learn how to create a flowchart, improve a process, and summarize the results. You will create a process to improve flowcharts.
Process Improvement Flowchart
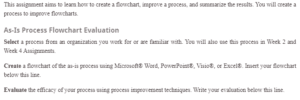
As-Is Process Flowchart Evaluation
Select a process from an organization you work for or are familiar with. You will also use this process in Week 2 and Week 4 Assignments.
Create a flowchart of the as-is process using Microsoft® Word, PowerPoint®, Visio®, or Excel®. Insert your flowchart below this line.
Evaluate the efficacy of your process using process improvement techniques. Write your evaluation below this line.
Process Improvement Flowchart
Determine how the process can be improved based on the results of your evaluation.
Define metrics and measure the current process. Insert the metrics and measures below this line.
Use process improvement techniques to improve the process. Create a flowchart of the improved process using Microsoft Word, PowerPoint, Visio, or Excel. Use your professional judgment to ascertain how the future process will perform according to your metrics. Insert a new flowchart below this line.
Summary
Write a 350-word executive summary that includes the following:
· A brief description of the process based on the flowchart of the process’s current state
· The results of your process evaluation and how the weak points can be strengthened. Include a description of the process improvement technique(s) used.
· A brief description of process improvements based on the process of the future state
· How you anticipate the future process will perform based on metrics used to evaluate the process’s current state
· A description of your process improvement project to achieve the process’s future state
Insert your summary below this line.
Cite references to support your assignment.
Format your citations according to APA guidelines.
Submit your assignment.