Presenting Statistical Results for Decision Making
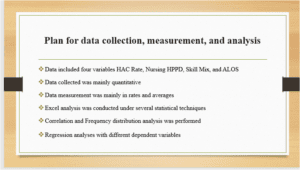
The analyzed data contained four variables. The Hospital-acquired condition rate (HAC Rate) is the number of hospital-acquired conditions (HAC) per 1,000 discharges which measures the extent of hospital errors. Nursing hours per patient day (Nursing HPPD) represents the number of nursing staff hours per patient day (HPPD); measures nurse staffing level and the Skill Nursing mix represents the percentage of nursing staff hours provided by Registered Nurses (RN); measures skill mix of nursing staff. The average length of stay (ALOS) represents the number of inpatient days per hospital discharge, which measures hospital efficiency. The analysis tool used was Excel, which enhanced the analysis of correlations, descriptive statistics, regression analysis using different variables, and distributions using a histogram.
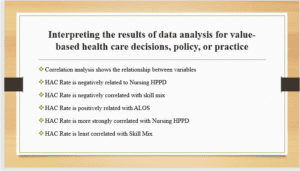
The correlation analysis shows the extent of the nature of the relationship, which includes the strength and direction of the relationship between the factors analyzed. Correlation analysis indicates that both Nursing HPPD and skill mix are negatively related to the HAC Rate, while ALOS has a positive relationship with the HAC rate. This implies that a higher number of nursing hours per patient day reduces the HAC rate. Similarly, a higher skill mix percentage leads to reduced HAC rates. A positive correlation between the HAC Rate and ALOS indicates that a higher average length of stay increases the HAC rate (Field, 2018). It could also mean that a high HAC rate also increases the ALOS rate. The analysis also shows that the HAC Rate is more strongly correlated with Nursing HPPD and least correlated with Skill Mix.
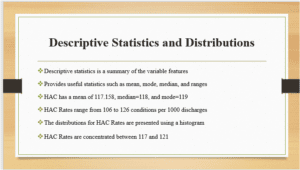
The descriptive statistics present a summary of the features of the variables, which can be used as the basis of decision-making. The descriptive statistics analysis provides useful statistics such as mean, mode, median, variance, standard deviation, and ranges, among other statistical measures. Since the HAC rate is the main dependent variable, the statistics for the variable were the center of interest. Therefore, HAC has a mean of 117.158, a median of 118, and a mode of 119. HAC Rate ranges from 106 to 126 conditions per 1000 discharges. The distributions for the HAC rates using the histogram indicate that HAC Rates are concentrated between 117 and 121. The descriptive statistics also show the characteristics of ALOS, skill mix, and nursing HPPD.
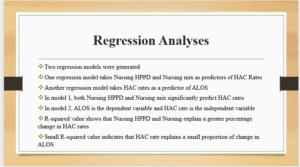
The regression analysis entailed generating two regression models, with one model taking Nursing HPPD and Nursing mix as predictors of HAC Rates, while another model takes HAC rates as a predictor of ALOS. In the first model, both the Nursing HPPD and Nursing mix significantly predict HAC rates, as shown by the significance of the F value and the p-values smaller than 0.05. In model 2, ALOS is the dependent variable, and HAC rate is the independent variable. R-squared values indicate that HPPD and nursing explain a greater proportion of change in HAC rates (Field, 2018). The small R-squared value indicates that the HAC rate explains a small proportion of change in ALOS. However, unlike the correlation model, the regression model shows that skill mix and ALOS are positively related to HAC rate, while Nursing HPPD is negatively related to HAC rates.
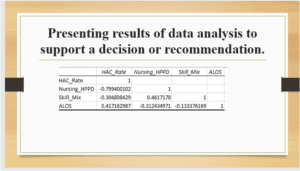
The correlation indicates that more nursing hours per patient day are necessary to reduce the HAC rate. A high percentage of nursing staff hours provided by Registered Nurses (RN), which measures the skill mix of nursing staff, is also essential for the hospital since it will also lower the HAC rate. A higher number of inpatient days per hospital discharge shows that the hospital is ineffective, which increases the HAC rate (Nghiem et al., 2022). Therefore, the correlation shows that the hospital should maintain a good ratio of nursing hours per patient day and the nursing staff hours provided by registered nurses. This means that the hospital should not overwork the nurses and, at the same time, ensure that they provide optimal service hours, which contributes to reduced HAC rates.
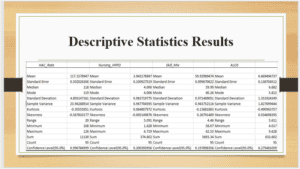
HAC rate has a mean of 117.1578, a median of 118, and a mode of 119 with a standard deviation of 4.893. The sample variance is 23.94. A high HAC score is synonymous with ineffective hospital operations and poor healthcare outcomes. By dividing 117.157 with 1000 patients, the rate is 0.117. The recommended HAC rate is between -3 and +3 (Mitchell, 2018). The mean of number of nursing staff hours per patient day (HPPD) is 3.94, which measures nurse staffing level. However, due to the larger correlation effect between HPPD and HAC rate, the hospital can increase the average nursing HPPD for a better HAC rate. The mean skill mix can also increase to lower the HAC rate. This means improving the number of registered nurses or slightly increasing the number of hours the registered nurses provide services. Also, lowering ALOS to a lesser average will be beneficial for the hospital’s ALOS.
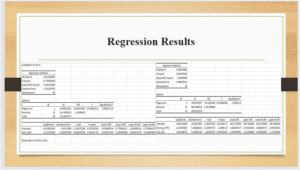
The coefficients of correlation between HAC rate and ALOS indicate that increasing the length of stay will increase the chances of HAC. Lowering the number of days a patient spends in the hospital will be beneficial in reducing the HAC rate. Particularly, increasing the ALOS by one unit will increase the HAC rate by 0.115 units. Similarly, a unit change in skill mix by 0.4115 will change the HAC rate by one unit. On the other hand, a decrease in nursing HPPD by -4.1639 will increase the HAC rate by one unit.
Although the HAC rate at the hospital is within the recommended range, the hospital can implement a number of strategies to further reduce the HAC rate based on the analysed data. Firstly, the hospital should aim to reduce the Average Length of Stay (ALOS) by improving the treatment processes and efficacy, as Horn et al. (2022) recommended. Logically, an increased length of stay in a hospital will increase the probability of errors and conditions that arise for patients in the hospital. The hospital can also increase the number of Nursing Hours Per Patient Day (HPPD), which closely corresponds to increasing the percentage of nursing staff hours provided by Registered Nurses. However, the analysis recommends optimizing the number of hours the nursing staff works to ensure optimal working conditions. For instance, subjecting nurses to lengthy working hours may lead to more errors and poor healthcare outcomes. The hospital can also offer improved training to nursing staff.
ORDER A PLAGIARISM-FREE PAPER HERE
We’ll write everything from scratch
Question 
Create an 8-10 slide PowerPoint presentation about the statistical results with recommendations for health system
leadership and a 2-4 page executive summary that provides additional context to the results of data analysis.
IInnttrroodduuccttiioonn
Presenting Statistical Results for Decision Making
The ability to translate analytic results into clear, concise, and actionable results is a vital skill for healthcare
administrators. Because decision-making is increasingly data-driven and evidence-based, managers are frequently
required to formally present statistical results to leadership. Sometimes, decision-makers differ as to how
well they comprehend the information being delivered. Your job as a healthcare professional is to know how to
distill and synthesize data analytics and present complex concepts in the pursuit of value, quality, and safety. You
must be able to clearly communicate the results of your team’s data analysis, which is both insightful and
informative. How much your work is valued can depend heavily on how well the results of that analysis are
articulated. Effectively communicating the results so the issues and recommendations are clear and explicit can
greatly enhance the value of your analytic work.
For this assessment, you will evaluate the approach of an analytics team and interpret and present statistical
results to support a health care recommendation.
OOvveerrvviieeww && PPrreeppaarraattiioonn
Complete the following simulation:
• Vila Health: Presenting Statistical Results for Decision Making. In this simulation, you will evaluate,
interpret, and present statistical results to support a healthcare recommendation.
IInnssttrruuccttiioonnss
This assessment has two deliverables:
1. Prepare an 8–10 slide PowerPoint presentation about the statistical results with recommendations to
health system leadership.
◦ Ensure the slides graphically communicate the findings.
◦ Ensure your presentation is relevant to and easily understood by everyone in the audience.
◦ Be sure your written communication is free of errors that detract from the overall message
◦ Include an APA-formatted references slide at the end of the presentation.
◦ Use Kaltura or similar software to record your presentation. The presentation should last no more
than 3 minutes, and it should contain audio of you speaking. You may use alternative programs or
Course Navigation
Assessment 4 Instructions: Presenting Statistical Results for … https://courserooma.capella.edu/webapps/blackboard/content/listContent…
1 of 3 12/22/2022, 4:22 PM
technology, provided you can still create a presentation with visuals and recorded audio.
◦ Before you begin recording, create a script, speaker notes, or a detailed outline that you can
refer to as you record. This professional best practice will help you prepare for your
presentation and serve to clarify any insufficient or unclear audio in your recording