Predictive and Qualitative Analysis Report of Pastas R Us
Pasta R Us is a chain of fast-casual restaurants specializing in noodle-based dishes, soups, and salads. Since its inception, the business development team has favored opening new restaurants in areas (within a 3-mile radius) that satisfy the following demographic conditions:
- Median age between 25 – 45 years old
- Household median income above the national average
- At least 15% of the college-educated adult population
The purpose of this analysis is to look at the new loyalty card that marketing debuted, see how effective the usage is, and see if any improvements can be made to the current card.
Scope and Descriptive Statistics
Descriptive statistics give short or small summaries of the sample and measure of data. The two basic measure categories in descriptive statistics are central tendency and variability or spread. The measures of central tendency are described as the middle or center of the data set. The measure of central tendency consists of mean, median, and mode. The measure of variability or spread isis the data dispersion within the set. Variability or spread are standard deviations, variance, min, max, Kurtosis, and skewness.
This report will include some tables, graphs, and summaries that will help the management of Pasta R Us to decide whether the information and data collected from the loyalty card can be used to expand or add new locations. A descriptive analysis will be done and used to assist in deciding on the loyalty cards placed in the expansion plans. The dataset Pastas R Us data database from (n=74) restaurants will be compared. Each data from the loyalty s sales will be used and analyzed to determine feasibility better. The data used will be Sales growth, Loyalty card, Median Income, Median age, and bachelor’s degree percentage ales captures will be used and analyzed to determine feasibility better. A descriptive analysis will be done on each measure to decide on expansion or new locations.
Loyalty Card and Sales Growth
Table 1

Scatter Plots
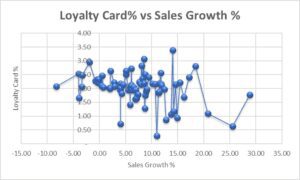
The scatter plot seems not to have any specific or discernable pattern, so loyalty cards and sales growth do not correlate.
Analysis of Scatter Plots and Regression Equations
Scatter plots are used to determine trends in statistical data, showing a relationship between two variables. A scatterplot sometimes has a center line, called a regression or trend line, that runs through it. The more concentrated the dots are in relationship to this line will show the trend or strength of the relationship between the variables. It will also show the negative or positive between the variables with the slope. It can also show if the data pattern is linear or non-linear (straight or curved). It is also easy to see outliers, cluster groups, and gaps that help with the data analysis.
Median Age and Sales/ Square Feet
Descriptive Analysis: Median Age and Sales/Square Feet
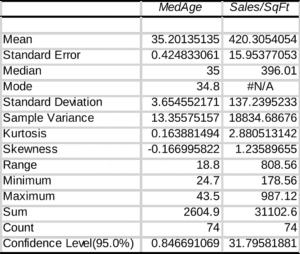
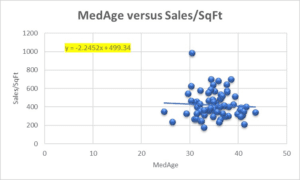
The regression equation is (y=-2.245x+499.34)
The relationship between the two variables (MedAge and Sales/SqFt shows a very weak negative relationship between the variables. The trend line appears to be going slightly down. The scope of the line is at negative -2,245. I see no real relevant correlation between the two variables.
Loyalty Card % versus Sales Growth %
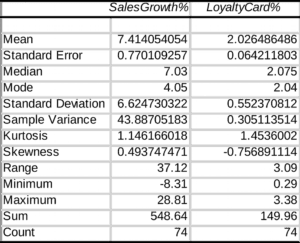
Descriptive Analysis: Loyalty Card % and Sales Growth %
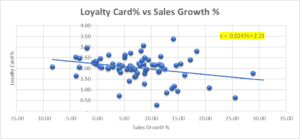
The regression equation is (y=-0.0247x+2).
This scatterplot shows a negative relationship between the two variables. The trend line is going downwards. This means the slope of the line is negative at -0.0247. The points appear to be clustered around the trend line. If anything, this shows that loyalty card percentage hurts sales.
Median Income and Sales/Square feet
Descriptive Analysis: Median Income and Sales/Square feet
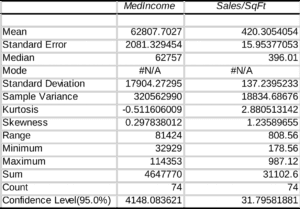
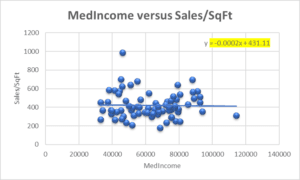
The regression equation is (y=-0.0002x+431.11)
Bachelor’s degree and Sales/Square feet
Descriptive Analysis: Bachelor’s degree % and Sales/Square feet
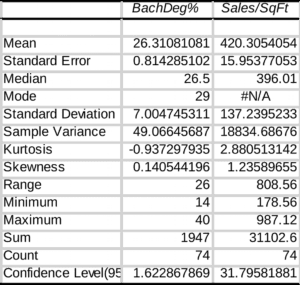
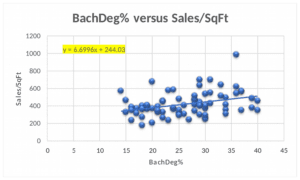
The regression equation (y=6.6996x-244.03)
The observation of the scatter plot says that the relationship between the two variables, bachelor’s degree%, and Sales/SqFt have a positive relationship. Positive relationships are a clear line that goes up. The slope of the line (6.6996) says that as the Sales/SqFt increases by 1, the bachelor’s degree% increases by (6.6996). This graph and table show that having a bachelor’s degree shopper increases sales per sq. foot in that location.
Recommendation and Implementation
Based on all the data collected and analyzed, I have come up with some recommendations and strategies for the future. In looking at all the data for me, the expansion criteria that would be most effective would be the shoppers with bachelor’s degrees and how it increases sales/sq. Ft. This seems to be the strongest correlation and would give us the most promising success rate. I do not believe that the loyalty card at this point is a strong indicator or shows a strong correlation to sales growth. The next demographic I believe we should target is the age group above the mean of 35.20. The locations with the age group of 35+ seem to have stronger sales/sq. Ft as well. Also, I believe we should target a younger crowd as we are not seeing as many patrons under the 35.20 mean, and we need to market more to that group. The company would be wise to keep using the loyalty card information to keep up with the customer’s demographics, but it does not currently produce enough data regarding the expansion or new stores. The other recommendation would be to get the data from doing surveys to get a sample of the demographics and spending.
References
Doane & Seward (2020). Applied statistics in business and economics (6th ed.). .website. Pasta R Us Inc. database. (n.d.).
Descriptive Statistics. (2019). In Investopedia. Retrieved from https://www,investopedia.com
ORDER A PLAGIARISM-FREE PAPER HERE
We’ll write everything from scratch
Question 
As a sales manager, you will use statistical methods to support actionable business decisions for Pastas R Us, Inc., a fast-casual restaurant chain specializing in noodle-based dishes, soups, and salads. In simpler terms, you are reviewing available information to determine if what your company is doing works. In this assessment, you use predictive and qualitative analysis skills to create a report for the executive team from available Pastas R Us, Inc. data about the effectiveness of the current expansion criteria, loyalty card program, and marketing position.
Predictive and Qualitative Analysis Report of Pastas R Us
Scenario
Since its inception, the Pastas R Us business development team has favored opening new restaurants in areas that satisfy the following demographic conditions within a 3-mile radius:
- The median age is between 25–45 years old.
- The median household income is above the national average.
- At least 15% of the adult population is college educated.
Last year, the marketing department launched a loyalty card strategy to increase sales. Under this program, customers present their loyalty cards when paying for their orders and receive some free food after making 10 purchases.
The company has collected data from its 74 restaurants to track important variables such as average sales per customer, year-on-year sales growth, sales per sq. ft., loyalty card usage as a percentage of sales, and others. A key metric of financial performance in the restaurant industry is annual sales per sq. ft. For example, if a 1,200 sq. ft. restaurant recorded $2 million in sales last year, it sold $1,667 per sq. ft.
Preparation
Analyze the Pastas R Us charts file for your report, including the scatter plots and regression equations for the following pairs of variables:
- “Sales/Sq.Ft. ($)” versus “Bach. Degrees (%)”
- “Median Income ($)” versus “Sales/Sq.Ft. ($)”
- “Median Age (Years)” versus “Sales/Sq.Ft. ($)”
- “Loyalty Card (%)” versus “Sales Growth (%)”
Assessment Deliverable
Write a 700- to 1,050-word predictive and qualitative analysis report of Pastas R Us, Inc. that includes the following sections: scope and descriptive statistics, analysis, and recommendations and implementation.
Section 1: Scope and descriptive statistics
- State the report’s objective.
- Discuss the nature of the current data. What variables were analyzed?
- Summarize your descriptive statistical findings from Week 1.
Section 2: Analysis
- Interpret the scatter plots and designate the type of relationship (increasing/positive, decreasing/negative, or no relationship) observed in each one.
- Determine what you can conclude from these relationships. You may include a copy of each chart in your report, but it is not required.
Section 3: Recommendations and Implementation
- Based on the findings, assess which expansion criteria seem more effective. Could any expansion criterion be changed or eliminated? If so, which one(s) and why?
- Based on the findings, does it appear as if the loyalty card is positively correlated with sales growth? Would you recommend any changes to this marketing strategy?
- Based on the findings, recommend market positioning that targets a specific demographic. (Hint: Are younger people patronizing the restaurants more than older people?)
- Include how the local culture and communities are represented in your market position in your recommendations.
- Indicate what information should be collected to track and evaluate the effectiveness of your recommendations. How can this data be collected? (Hint: Would you use surveys/samples or census?)
Format your references according to APA guidelines.