Peer Responses
Replying to Person 1
Hello,
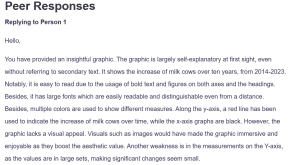
You have provided an insightful graphic. The graphic is largely self-explanatory at first sight, even without referring to secondary text. It shows the increase of milk cows over ten years, from 2014-2023. Notably, it is easy to read due to the usage of bold text and figures on both axes and the headings. Besides, it has large fonts which are easily readable and distinguishable even from a distance. Besides, multiple colors are used to show different measures. Along the y-axis, a red line has been used to indicate the increase of milk cows over time, while the x-axis graphs are black. However, the graphic lacks a visual appeal. Visuals such as images would have made the graphic immersive and enjoyable as they boost the aesthetic value. Another weakness is in the measurements on the Y-axis, as the values are in large sets, making significant changes seem small.
References
USDA. (n.d.). USDA – National Agricultural Statistics Service – Charts and Maps – Milk Cows: Inventory by Year, US. Www.nass.usda.gov. https://www.nass.usda.gov/Charts_and_Maps/Milk_Production_and_Milk_Cows/milkcows.php
Replying to Person 2
Hello,
The graphic you chose is quite informative. Your graphic shows the productivity increase in economies resulting from AI usage in select countries. From the outset, one of the strengths of the graphic is the inclusion of data from highly reputable sources. Accenture and Frontier Economics contain reliable data. Also, the graphic has a visual appeal. The combination of blue colors, black text, and white background create an attractive sight that would attract one’s attention at first sight. On the same note, including flags representing different countries adds to the aesthetic value of the graphic. However, listing the percentages on the respective bars instead of the x-axis poses challenges to a reader. One may miss these crucial details at first glance since they are not easily distinguishable. The percentages would have been more distinguishable if they were included on the x-axis or outside the bars and in different colors.
References
Buchholz, K. (2020, December 15). Infographic: Where AI is Aiding Productivity. Statista Infographics.https://www.statista.com/chart/23779/ai-productivity-increase/
ORDER A PLAGIARISM-FREE PAPER HERE
We’ll write everything from scratch
Question 
Question: Reply by suggestions about what other strengths or weaknesses are present in the graphic your peer posted.
PERSON 1
https://www.nass.usda.gov/Charts_and_Maps/Milk_Production_and_Milk_Cows/milkcows.php
This graph shows the number of milk cows in the United States by thousand head over the previous ten-year period. The text is easy to read, and numbers are in bold and dark colors. The y-axis goes up by increments of 50 (thousand head of cattle) which makes the smaller change between years 2015 and 2016, 2017 and 2018, and 2022 to 2023 easier to read than if the increments went by hundreds or a larger number. There is also a line of text on the graph that states the total percent increase in cattle from years 2014 to 2023.
Peer Responses
Person 2
https://www.statista.com/chart/23779/ai-productivity-increase/
I chose a graph about AI’s influence on productivity for this week’s discussion post. This graph tells the story of the projected increase in productivity in developed countries due to AI. The graph reinforces the text by showing how much labor productivity is expected to increase for each country. It appears to be ethical as it was created from analyses by two reputable sources. The graph features well-labeled columns. The data sources are clearly identified below the graph. The countries’ flags add more color to the chart, making locating them easier. At first glance, I thought the graph was missing information since the percentages were listed on the bar instead of on the axis. That would be the only thing I would change.