Mercer County, New Jersey
County Demographics
Municipalities
Mercer County is located in west-central New Jersey. It borders the Milestone River to the east and northeast and Pennsylvania to the west. In addition, it consists of twelve municipalities (Mercer County, 2022). The county has several unique features. First, the county features two of the most populated communities in New Jersey: Hamilton and Trenton. In addition, Mercer County is home to Princeton University. Lastly, the county features a mix of rural, suburban, and city life (Mercer County, 2022).
Population
According to the U.S. Census Bureau (2022), the current Population of Mercer County is 385,898. The majority of the residents are white (63.3%), while African Americans (21.1%) and American Indians (0.6%) represent the minorities. In terms of gender, women make up 51.1% of the Population. Regarding age distribution, 15.6% of the Population is 65 years and above, while 21.2% is 18 years and above. Lastly, 5.6% of the Population is under five years old (U.S. Census Bureau, 2022).
Get in touch with us at eminencepapers.com. We offer assignment help with high professionalism.
Social Determinants of Health
County Health Rankings
Mercer County is ranked 13 out of the 21 counties of New Jersey in terms of health. However, specific health indicators suggest that residents in the county have better access to healthcare compared to other counties in New Jersey (GMPHP, 2021). While the ratio of residents to physicians is 1,179 to 1 for New Jersey, the balance is 999 to 1 for Mercer County (GMPHP, 2021). The percentage of residents to dentists is 1,185 to 1 for the county, while the balance for the state of New Jersey is 1,135 residents to one dentist (GMPHP, 2021). The county, however, lags in access to mental health providers. The ratio of residents to mental health providers is 295 residents to one provider, while that of the state is 415 residents per one mental health provider (GMPHP, 2021).
Economic Stability
Mercer County ranks below New Jersey regarding median income and economic indicators. The median income for the county is $83306, while the median income for the state of New Jersey is $82,545 (U.S. Census Bureau, 2022). However, the county has a higher median income than the U.S. median ($62,843) in terms of median income. The number of households requiring government support is also lower. Only 8.4% of the homes in the county have supplemental nutrition assistance program benefits, compared to 8.7% for the state of New Jersey (GMPHP, 2021). The value is lower than the U.S. average of 11.7% (GMPHP, 2021). However, there are significant racial disparities concerning economic stability. Data shows that African Americans have a higher risk of poverty and tend to have a lower median income than whites. They are also likely to have lower educational attainment and less likely to own homes.
Education
Essentially, 89.6% of the Population has a high school diploma and above in educational attainment. The percentage of people with a bachelor’s degree or higher is 43.5% (U.S. Census Bureau, 2022). However, African Americans in the county tend to have lower educational attainment. Around 18.4% of African Americans have a bachelor’s degree or higher. In comparison, 44.9% of whites in the county have a bachelor’s degree or higher (GMPHP, 2021). Asian Americans, while a minority in the county, have the highest educational attainment. Accordingly, 80.1% of Asian Americans in the county have a bachelor’s degree (GMPHP, 2021).
Social and Community Context
Exposure to violence can lead to mental and physical health problems. Certain geographical areas of the county experience higher violence levels than others. Of all Mercer municipalities, Trenton has the highest rate of violence (Ronollo & McCullough, 2021). The high crime rate in Trenton can be attributed to a wide range of factors, including but not limited to poverty, systemic racism, and substance abuse (GMPHP, 2021).
Health and Healthcare
Among all residents in the county, only 9.6% of the Population lacks health insurance. Notably, 7.0% of the Population under 65 has a disability (U.S. Census Bureau, 2022). However, disparities in income mean that African Americans are less likely to have health insurance. For example, African Americans in Trenton have a median income of less than half the county average (Ronollo & McCullough, 2021). The plight of African Americans in the city is further exacerbated by systemic racism and historical injustices. As such, African Americans in the county are likely to die from premature death and tend to have a higher prevalence of chronic illnesses.
Health Behaviors
The health behaviours of county residents are similar to those of other state municipalities. The Behavioral Risk Surveillance Survey shows that 25% of residents reported not engaging in any physical activity. In comparison, 70% of residents reported taking five servings of fruits and vegetables daily. The rate of physical activity is higher than the 2020 Healthy People target (United Way of Greater Mercer, 2022). However, substance abuse remains a problem in the county. In terms of substance abuse admissions, Trenton remains one of the worst affected cities. According to 2019 statistics, there were 2375 substance abuse admissions in the city (Borys, 2019). The figure is around nine times that of East Windsor township. These estimates show that in addition to high poverty levels in Trenton, there are significant disparities in the city of Trenton.
Health Outcomes
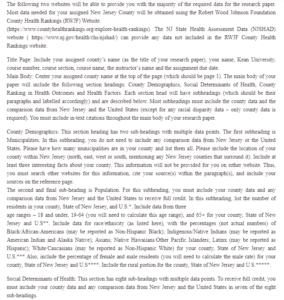
There are significant racial disparities in terms of health outcomes. African Americans in the county have one of the worst rates of premature deaths in the county. The rate is almost double that of whites.
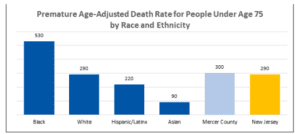
Fig 1: 2017-201 premature death estimates (Ronollo & McCullough, 2021)
Neighborhood and the Built Environment
The American Lung Association (2022) gave the county an F regarding air quality. Such a grade indicates that the county has a poor quality of air. According to the American Lung Association, the county had one red day and 26 orange days. Essentially, these findings indicate the presence of particle and ozone pollution in the air. There are multiple sources of particle pollution, including disease engines, coal plants, wood-burning devices, and wildfires. The presence of particulate pollution in the air represents a significant risk to the health of residents. Particulate pollutants, including polycyclic aromatic hydrocarbons, dioxins, volatile organic compounds, sulphur dioxide, and nitrogen dioxide, pose a significant threat to the cardiovascular and respiratory systems of the residents (Manisalidis, Stavropoulou, Stavropoulos, & Bezirtzoglou, 2020).
In addition to pollution, homelessness represents a significant threat to the health and welfare of residents. According to 2019 estimates, African Americans accounted for 62.5% of all homeless individuals in the county (Ronollo & McCullough, 2021). Around 17% of the Population experienced a severe cost burden for housing. Estimates suggest that 19% of all households in the county experienced one of the following problems: (a) lack of plumbing facilities, (b) lack of kitchen facilities, (c) severe cost burden, and (d) overcrowding (Ronollo & McCullough, 2021). However, there are significant disparities in terms of housing access. African Americans in the county are likely to experience severe cost burdens for housing. The African-American Population in the county is also expected to suffer from disabling problems such as chronic health problems, physical disability, and substance abuse disorders (Ronollo & McCullough, 2021). These conditions, coupled with high levels of poverty, further exacerbated health problems in the Population.
The county is ranked in the higher middle range among other counties in New Jersey. People in the county have increased access to exercise opportunities, including tennis courts, basketball courts, and park systems (United Way of Greater Mercer, 2022). The average car ownership in the state is two cars per household. Most people in the county (62.6%) drove alone to work, with the average commute time being 27.8 minutes (DataUSA, 2022). Those without their cars have access to numerous other transportation trains, including light rail, trains, and buses.
County Ranking in Health Outcomes and Health Factors
Health Outcomes
In 2019, the life expectancy in the county was 80.7 years. The life expectancy for females was 83.1 years, while that for males was 78.1 years (NJSHAD, 2022). There are significant racial disparities in the life expectancy of the residents. While African Americans in the county had a life expectancy of 76.9 years, their Asian peers had a life expectancy of 92.1 years (NJSHAD, 2022). The percentage of live births in the country was 1.1% for whites, 3.6% for African Americans, and 1.7% for Hispanics (NJSHAD, 2022). The fetal mortality in the county was 4.4 per 1000 live births.
On the other hand, the perinatal mortality rate was 9.6 per 1000 live births in 2018 (NJSHAD, 2022). There are significant racial disparities in terms of infant deaths. The rate of infant deaths among African Americans is higher. Estimates suggest that infant mortality among African Americans is 205% higher among African Americans than the state average. The majority of these deaths are recorded in Trenton, where the rate is 256% above the state rate. These high rates of infant deaths, especially in the African American Population, suggest disparities in access to health among African Americans.
Poor mental health remains a significant problem in the county. According to 2017 estimates, around 20.1% of the Population had a history of depression, with the people reporting an average of 4.3 days of mentally unhealthy days (GMPHP, 2021). The number of mentally ill days is higher for county residents compared to the state average of 3.8% (GMPHP, 2021). In terms of premature deaths, African Americans have the highest rates of early deaths (530 per 100,000 individuals), followed by whites (290 per 100,000 people) (GMPHP, 2021). There are significant disparities in the rate of premature deaths in the county. Trenton has the highest early death rates and the lowest life expectancy (69 years) (GMPHP, 2021). It is essential to note that Trenton is a minority town, with African Americans making up a large population. According to 2019 estimates, there were 4600 unintentional deaths in the state. The prevalence of accidental deaths in the state was 49.1 per 100,000 people (NJSHAD, 2022).
In 2020, there were 2,245 cases of sexually transmitted diseases in the county (NJSHAD, 2022). The number is likely higher, given that most people are unwilling to seek testing or medical treatment for sexually transmitted diseases. In 2021, the county had 57 cases of confirmed drug overdoses (Steffen, 2021). Alcohol remains one of the most critical threats to the health of the residents. Estimates suggest that alcohol-impaired driving deaths account for 22% of all deaths in the county, with 16% of the Population involved in alcohol engaging in excessive drinking (County Health Rankings & Roadmap, 2022). The teen pregnancy in the county is estimated to be 14 per 1,000 female individuals (County Health Rankings & Roadmap, 2022).
Health Factors
Mercer County ranked 12th in 2021 in terms of length of life and 13th out of 21 counties in terms of quality of life (GMPHP, 2021). On the other hand, it ranked eighth in health behaviours, 9th in clinical care, 12th in socioeconomic factors, and 7th in terms of the physical environment. Based on 2020 data, it seems that health factors in the county are improving (GMPHP, 2021).
References
American Lung Association. (2022, April 11). If you live in Mercer County, the air you breathe may put your health at risk. Retrieved from American Lung Association: https://www.lung.org/research/sota/city-rankings/states/new-jersey/mercer
Borys, S. (2019). Substance abuse overview 2019: Mercy County. Trenton, NJ: Department of Human Services, State of New Jersey.
County Health Rankings & Roadmap. (2022, April 11). Mercer. Retrieved from County Health Rankings & Roadmap: https://www.countyhealthrankings.org/app/new-jersey/2021/rankings/mercer/county/outcomes/overall/snapshot
DataUSA. (2022, April 11). Mercer County, NJ. Retrieved from Data USA: https://datausa.io/profile/geo/mercer-county-nj
GMPHP. (2021). Greater Mercer Public Health Partnership: 2021 community health needs assessment. Trenton, NJ: Greater Mercer Public Health Partnership.
Manisalidis, I., Stavropoulou, E., Stavropoulos, A., & Bezirtzoglou, E. (2020). Environmental and health impacts of air pollution: A review. Frontiers in Public Health, 8(14), 1-12.
Mercer County. (2022, April 11). Out Towns. Retrieved from Mercer County: The Capital County: https://www.mercercounty.org/community/about/our-towns
NJSHAD. (2022, April 11). Mercer County Public Health Profile Report. Retrieved from New Jersey State Health Assessment Data: https://www-doh.state.nj.us/doh-shad/community/highlight/profile/LifeExpectancy.County/GeoCnty/11.html
Ronollo, K., & McCullough, A. (2021). Mercer County needs assessment 2020—Trenton, NJ: New Jersey Department of Children and Families.
Steffen, C. (2021, December 31). Mercer County sees a record-breaking number of overdose deaths in 2021. Retrieved from WFMJ: https://www.wfmj.com/story/45563074/mercer-county-sees-recordbreaking-number-of-overdose-deaths-in-2021
United Way of Greater Mercer. (2022, April 11). Risk and protective lifestyle behaviours. Retrieved from United Way of Greater Mercer County: https://www.uwgmc.org/CHA5
U.S. Census Bureau. (2022, April 11). Quick facts: Mercer County, New Jersey. Retrieved from U.S. Census Bureau: https://www.census.gov/quickfacts/mercercountynewjersey
ORDER A PLAGIARISM-FREE PAPER HERE
We’ll write everything from scratch
Question 
The following two websites will be able to provide you with the majority of the required data for the research paper. Most data needed for your assigned New Jersey County will be obtained using the Robert Wood Johnson Foundation County Health Rankings (RWJF) Website.
(https://www.countyhealthrankings.org/explore-health-rankings). The NJ State Health Assessment Data (NJSHAD) website ( https://www.nj.gov/health/chs/njshad/) can provide any data not included in the RWJF County Health Rankings website.
Mercer County, New Jersey
Title Page: Include your assigned county’s name (as the title of your research paper), your name, Kean University, course number, course section, course name, the instructor’s name and the assignment due date.
Main Body: Center your assigned county name at the top of the page (which should be page 1). The main body of your paper will include the following section headings: County Demographics, Social Determinants of Health, County Ranking in Health Outcomes and Health Factors. Each section head will have subheadings (which should be their paragraphs and labelled accordingly) and are described below. Most subheadings must include the county data and the comparison data from New Jersey and the United States (except for any racial disparity data – only county data is required). You must include in-text citations throughout the main body of your research paper.
County Demographics: This section heading has two sub-headings with multiple data points. The first subheading is Municipalities. In this subheading, you do not need to include any comparison data from New Jersey or the United States. Please have how many municipalities are in your county and list them all. Please include the location of your county within New Jersey (north, east, west or south, mentioning any New Jersey counties that surround it). Include at least three interesting facts about your county. This information will not be provided for you on either website. Thus, you must search other websites for this information, cite your source(s) within the paragraph(s), and include your sources on the reference page.
The second and final sub-heading is Population. For this subheading, you must include your county data and any comparison data from New Jersey and the United States to receive full credit. In this subheading, list the number of residents in your county, State of New Jersey, and U.S.*. Include data from three
age ranges – 18 and under, 19-64 (you will need to calculate this age range), and 65+ for your county, State of New Jersey and U.S.**. Include data for race/ethnicity (as listed here), with the percentages (not actual numbers) of Black/African-Americans (may be reported as Non-Hispanic Black); Indigenous/Native Indians (may be reported as American Indian and Alaska Native); Asians; Native Hawaiians/Other Pacific Islanders; Latinx (may be reported as Hispanic); White/Caucasians (may be reported as Non-Hispanic White) for your county, State of New Jersey and U.S.*** Also, include the percentage of female and male residents (you will need to calculate the male rate) for your county, State of New Jersey and U.S. ****. Include the rural portion for the county, State of New Jersey and U.S. *****.
Social Determinants of Health: This section has eight sub-headings with multiple data points. To receive full credit, you must include your county data and any comparison data from New Jersey and the United States in seven of the eight sub-headings.
The first sub-heading is County Health Rankings. You do not need to include any State or U.S. comparison data for this subheading. In this sub-heading, the number your county is ranked (out of 21 New Jersey counties) for health outcomes and health factors (this may not be the same number). Include what is used to measure and rank health outcomes and what is used to measure and rank health factors in every county.
The second sub-heading is Economic Stability. In this sub-heading, include data on median house income, income inequality, unemployment, children in poverty, and children in single-parent homes for your county, State of New Jersey and U.S. For your county, include the racial disparity data in median house income and for children in poverty. If any data is not provided for your county on the RWJF website, you must mention that in your paper.
The third sub-heading is Education. In this sub-heading, include data on high school graduation and some college for your county, State of New Jersey and U.S.
The fourth sub-heading is Social and Community Context. In this sub-heading, include data on social associations, violent crimes and homicide for your county, State of New Jersey and U.S.
The fifth sub-heading is Health and Health Care. In this sub-heading, include data on uninsured, the ratio of primary care physicians, the ratio of dentists, the percentage of mental health providers, preventable hospital stays and mammography screening for your county, State of New Jersey and the U.S. Include the racial disparity data for your county in preventable hospital stays and mammography screening. If any data is not provided for your county on the RWJF website, you must mention that in your paper.
The sixth sub-heading is Health Behaviors. In this sub-heading, include data on adult smoking, obesity, physical inactivity and excessive drinking for your county, State of New Jersey and U.S.
The seventh sub-heading is Health Outcomes. In this sub-heading, include data on premature deaths, poor or fair health, poor physical health days, poor mental health days, injury deaths, alcohol-impaired deaths, drug overdose deaths, motor vehicle crash deaths, teen births, low birth weight and sexually transmitted infections for your county, State of New Jersey and the U.S. Include racial disparity data for your county for premature deaths, teen births and low birth weight. If any data is not provided for your county on the RWJF website, you must mention that in your paper.
The eighth and final sub-heading is Neighborhood and the Built Environment. In this sub-heading, include data on air pollution, severe housing problems, food environment index, access to exercise opportunities, driving alone to work, and long commutes for your county, State of New Jersey, and U.S. Include racial disparity data for your county for driving alone to work. If any data is not provided for your county on the RWJF website, you must mention that in your paper.
County Ranking in Health Outcomes and Health Factors: This section heading has two sub-headings with multiple data points. You will not need to include any comparison data from New Jersey or the United States for either subheading.
The first sub-heading is Health Outcomes. In this sub-heading, include your county’s Length of Life and Quality of Life ranking.
The second sub-heading is Health Factors. In this sub-heading, include your county’s Health Behaviors, Clinical Care, Social and Economic and Physical Environment ranking.