Memo – Microeconomics Simulations
Memo
To: My Business Partner
From: [Insert your name]
Date: [Insert date]
Re: Microeconomics Simulations
Introduction
This memorandum report identifies and explains critical microeconomic principles using a set of simulation games. The outcome of these games illustrates how microeconomic principles can be applied within real-life situations to help us make better business decisions. This report is a summary of the simulations I played and their results, which include the key takeaways and their significance, for your review and reference. It is divided into the following sections:
- Competitive Markets and Externalities
- Production, Entry, and Exit
- Market Structures (including the Price Discrimination and Cournot simulations)
- Conclusions
- References
Comparative Advantage
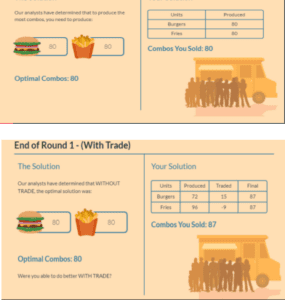
Opportunity Cost
The phrase opportunity refers to the value one gives up to obtain something. If the cost of the choices is beyond the benefits to the organization, it is recommended not to go forth. In addition, a person might differentiate their company’s possible cost from that of a competitor. If we can lower our expectation costs beneath our rivals, our company will gain an advantage over the competitors. Comparative advantage can be defined as the capability of one producer to make a commodity at a lesser opportunity cost than another producer. This would benefit our company to obtain an advantage and even attract more customers than our competitors. Besides, our company could use the comparative advantage of each for the mutual good of both firms through the use of exchanges. Someone cannot have a relative advantage over another with every good. If we can start trades with goods with which we have comparative advantages, we can maximize our outputs and profits, as indicated by the simulation above.
Production Possibility Frontier (PPF)
A production possibility frontier model (PPF) is a chart that shows the many output amalgamations that can be produced by an economy with the available production technology and factors. According to trade and specialization, PPF can be employed to show the numerous quantity products that our company can produce. We can evaluate the different combination amounts the firm can create and the impractical amount of combinations that can be made. Therefore, we can use PPF to discover the most efficient goods our business can create.
Competitive Markets and Externalities
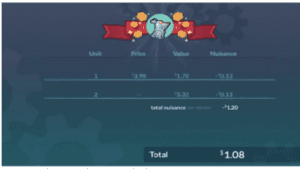
Figure 2.1
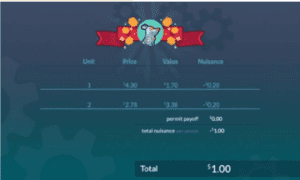
Figure 2.2
Impacts of Policy Interventions on the Supply and Demand Equilibrium
Tax policy interference may impact the equilibrium. Every time the state levies taxes on us as the seller or our customers, i.e., the buyer, there is an impact on the demand and supply curve (Mankiw, 2021). If the tax is executed, there is a rise in the supply curve since the product’s cost elevates. Consequently, the balance will change to higher on price and lower on demand.
Determinants of Price Elasticity
There are three determinants of price elasticity of demand: the presence of close alternatives, needs versus affluence, and time horizons. A good with a large number of similar goods is said to be more elastic. One excellent example of the above is TV service providers. In the old days of satellite and cable television, the same market had fewer competitors. As a result, TV service providers could charge any amount they wanted, close the client into an agreement, and expect them to meet the amount demanded. However, with the emergence of streaming services came the competition. Today, DirecTV, Dish, and Charter, among others, must fight for and sustain customers who are leaving landlines and dish televisions for internet streaming television. The distinction between needs and luxuries is another factor to consider. Going out for dinner is an act one would consider a luxury. When people think about the above luxury, they must be concerned with how much they can afford at the restaurant. The place may be a venue they have been to before, but the menu prices have been raised. The above instance may help our consumers comprehend that although eating is a need, it is a luxury to acquire food. As a result, customers may choose to prepare the same meals at home and more cheaply, leading to the restaurant losing money and clients. Price limitations are a form of market intervention that leads to a manufacturer or consumer surplus.
How Policy Interventions May Cause Consumer/Producer Surplus
If the market interferes with adjusting the ceiling or floor of the price, it may impact the supply and demand curve if the price floor is higher or lower than the balance. A price floor is a legal limit on how high a product may be sold (Viscusi, Harrington Jr, Sappington, 2018). Suppose the price ceiling is below the equilibrium. In that case, it may cause a consumer surplus since the number of products demanded may exceed the amount we are allowed to sell, and the ceiling may never attain equilibrium. Product scarcity may be recorded when a government imposes a cost limit on a competitive market. A price floor may result in a similar effect of product surplus (Browning & Zupan, 2020). If the price ceiling is above the equilibrium, a product surplus occurs since the higher costs will lower the demand.
Production, Entry, and Exit
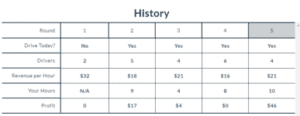
Figure 3.1
Factors to Consider Before Market Entry
We, as company owners, must review several factors before marker entry and exit. When deciding whether to enter a market or not, we must consider the business’s earnings. If the cost of the product is above the manufacturing price, it would be advisable we enter the market (Aaker & Moorman, 2017). As business owners, we must ensure that the firm is operating and incurring profits in the long run. Additionally, we must function at the lowest average total cost possible to achieve the above. As a result, the amount given cannot be increased or decreased. On the other hand, if we find out that the expenses are more than the income, we should leave the market. The business would still be required to cater for fixed costs, but it would save on variable costs of manufacturing the goods.
Marginal Costs
The marginal price is the growth in total cost due to the additional output unit. Every moment a business manufactures a new product, the marginal price increases. When evaluating the marginal cost of our company, we should estimate the number of goods we can make at the junction of the average and marginal costs. The mean price is derived from the division of the total price by the output amount (Mankiw, 2021). The section where the above crosses are called the ATCs methodical scale. With such a production level, businesses can produce goods with minimal ATC. After evaluating the above amount, we must decide whether our company has to change to achieve marginal profits. The marginal profit is similar to the product’s market cost and average revenue. If the marginal price is lower than the marginal earnings, the manufacturing of the good should be elevated. Conversely, if the marginal price is more than the marginal earnings, the manufacturing must be lowered. If the marginal cost equals the market price or marginal revenue, the firm will make more from the goods produced.
Impacts of Fixed Costs in the Short and Long-Run
A firm’s cost cannot alter the number of products created, such as utilities such as wages, rent, loans, and electricity. Fixed costs affect both the long and short run of a business since they can be averted in the long term. In the long run, to increase output, we must increase working hours or recruit more workers (Aaker & Moorman, 2017). The above are known as fixed costs and will affect the mean total cost, thus elevating the curve. In the long run, the above will keep limiting numerous goods that can be produced. Shifting costs can be used to avoid fixed costs in the long run. By so doing, the ATC will remain minimal for a long time while allowing for more output.
Market Structures
| Market Structure | Number of Firms | Type of Product Sold | Price Taker? | Price Formula | Freedom of Entry? | Short-run Profit? | Long-run Profit? | Industry Examples |
| Perfect Competition | Many | Identical | No | P=MC | Yes | Yes | Yes | Foreign exchange markets, agricultural markets |
| Monopolistic Competition | Few dominant firms | Differentiated | Yes | P<MC | Yes | Yes | Yes | Restaurant markets, streaming services markets |
| Monopolies | One | Unique | Yes | P=MC | No | Yes | Yes | Natural gas companies, water companies |
| Oligopolies | Few dominant firms | Differentiated or Identical | Yes | P=MC | No | Yes | Yes | Vehicle manufacturers, mass media companies |
Table 4.1
Market Inefficiencies Derived from Monopoly and Monopolistic Competitions
When a particular company is the only seller of products, and no other alternatives are available, then a monopoly will exist. The market inability that comes from the government-created monopolies is that they direct to higher prices and profits that may occur under certain competition because of copyright and patent regulations. Many goods may be sold by a competitive company as much as it wants. The price may not have any impact, but when the company raises production by a certain unit, the company will receive a market price for that unit. In contrast, the previous unit will not receive fewer units. Since the competing business is the price setter, the marginal revenue always goes along with the prices of goods. Every time a monopoly grows the output by a certain unit, a fact is that it must reduce the cost it charges for every available unit it sells since the reduction of the price impacts the income of the previously sold units. Consequently, the marginal revenue of a monopoly becomes smaller than the price. To make profits or be competitive, a monopoly or a monopolistic competitive business has to decide the quantity at which the marginal revenue must equal the marginal cost. Next, the demand curve should determine the price that will persuade customers to buy those products.
How Oligopolistic Firms Set Prices
Among the chief characteristics of an oligopolistic market include dependency, a restricted number of vendors, and the behavior of groups. Rather than getting prices from the market, oligopolies make their own pricing together as a cartel or under one company’s control. Oligopolies must be cautious since a single vendor may affect the earnings of all other vendors if they change the quantity of products they manufacture and the price they place under each good. Besides, an oligopoly is a market formation that features a restricted number of relatively big businesses and obstacles to the coming of other new firms. Monopolistic is a market formation characterized by a large number of small businesses which can enter into business and exit at any time. Examples of oligopolies include entertainment, media, and airlines. Among the businesses that work in the monopolistic competitive market include motels, restaurants, and hairdressers.
Determining Profitability
Diverse market formations result in different options for businesses when decisions are being made. In the end, the profitability of our company will be decided by factors present in the market structure in which it works on in the business. In a good market, marginal revenue will always be equivalent to the price. Nonetheless, the price may exceed the marginal revenue in other markets because our company may sell more units when it decides to lower its pricing per unit. Furthermore, monopolistic, oligopolistic, and monopolists compete to divide their goods so that they can sell at a higher price; the amount sold every single time is more elevated in great competition.
Conclusions
Every time a person decides to engage themselves in the industry, they should always understand microeconomics. Microeconomics constantly analyses an economic setting of prices and shifts in particular markets. It is vital to conduct a market investigation of goods that are produced and merchandised. Assessment should be done by our competitors around the area and online who are creating the exact goods or a similar variety of the same goods. Further, to gain more profit, the price of producing the goods must be moderately less to earn a profit margin.
References
Aaker, D. A., & Moorman, C. (2017). Strategic market management. John Wiley & Sons.
Browning, E. K., & Zupan, M. A. (2020). Microeconomics: Theory and applications. John Wiley & Sons.
Mankiw, N. G. (2021). Principles of microeconomics (#9 edition). Cengage.
Viscusi, W. K., Harrington Jr, J. E., & Sappington, D. E. (2018). Economics of regulation and antitrust. MIT Press.
ORDER A PLAGIARISM-FREE PAPER HERE
We’ll write everything from scratch
Question 
Memo – Microeconomics Simulations
Competencies
In this project, you will demonstrate your mastery of the following competencies:
- Inform business decisions using microeconomic models and theories
- Determine the impact of economic costs on organizational and individual decision-making
- Explain how market structure impacts a business’s entry and exit into a market and its ability to generate economic profit.
Scenario
You and your friend from college have just graduated. You majored in business, and your friend majored in a creative field. Your friend is highly inventive and has come up with an excellent idea for a new product. You both believe in this idea so much that you have agreed to become business partners. However, before you embark on your entrepreneurial adventure, you will have to explain some key microeconomics concepts to your partner that are important to make sound business decisions.
Your business partner is less than enthusiastic about this prospect and has never had an interest in what is often described as the dry and boring field of economics. Every time you try to engage your partner in practical discussions, they brush you off and decide to play video games instead.
Aha! This gives you an idea: What if you could convince your friend to learn about economics through games? You have found several simulation games that demonstrate in real and interesting ways the economic principles that you know your partner needs.
Once you have played the games, you will create a memorandum report summarizing the educational value of your experiment for your friend. In your memorandum, you will restate the key principles and takeaways of each simulation, as well as illustrate how these ideas are relevant to your future entrepreneurial success.
Directions
First, assemble the materials that you will need to complete this assignment:
- You will need several simulation report images for your memorandum. All the necessary data visualizations will be generated after you have completed each simulation game. You will be required to save image files of your simulation reports for your simulation discussions. These should also be used to create your memorandum report for the course project. If you have any questions or concerns about the simulation data that should be used for your project, you should promptly reach out to your instructor.
- Review and use the Project Template located in the What to Submit section.
You are expected to reference any source material used in your memorandum report with appropriate citations. To support you, a References page has been added to the project template with a citation for this course’s reading already provided. Any other references you add should be cited according to APA format.
Once you have assembled the required materials listed above, you can now begin drafting your memorandum report by completing the following steps:
- Comparative Advantage: Discuss the Comparative Advantage (With Trade) simulation that you played in Module Two. You should add the Production Decisions graph and the Production Trade graph (i.e., the graph showing how many hamburgers per fries) from your simulation report into the project template as Figures 1.1 and 1.2. Then, answer the following questions in the paragraphs below the figures:
- How does this simulation demonstrate how individuals evaluate opportunity costs to make business decisions? Use the Production Decisions graph from the simulation as a reference to explain what role the production-possibility frontier (PPF) has in the decision-making process.
- Explain how comparative advantage impacts a firm’s decision to engage in trade. Would a business’s decision to trade cause a change to its PPF? Provide specific reasoning to support your claims.
- Competitive Markets and Externalities: Discuss the Competitive Markets and Externalities simulations (both with and without policy interventions) that you played in Modules Three and Four. Add the Supply and Demand chart and the Outcomes by Market table from your simulation reports into the project template as Figures 2.1 and 2.2. Then, answer the following questions in the paragraphs below the figures:
- What impact do policy interventions have on the supply and demand equilibrium for a product? Provide specific examples from the simulation to illustrate.
- What are the determinants of price elasticity of demand? Identify at least three examples. Based on the outcome of the simulation, explain how price elasticity can impact pricing decisions and the total revenue of the firm.
- Based on the results of the simulation, can policy market interventions cause consumer or producer surplus? Explain why using specific reasoning.
- Production, Entry, and Exit: Discuss the Production, Entry, and Exit simulation that you played in Module Five. Add the Aggregate Outcomes chart from your simulation report into the project template as Figure 3.1. Then, answer the following questions in the paragraphs below the figure:
- Analyze a business owner’s decision-making regarding whether to enter a market. For example, what factors determined the driver’s market entry and exit in the simulation? Use economic models to support your analysis.
- How does a business owner apply the concept of marginal costs to decide how much to produce? For example, how did the driver determine how many hours to drive each day? Use economic models to explain.
- How does the impact of fixed costs change production decisions in the short run and in the long run? Use the average-total-cost (ATC) model included in the module reading chapters to demonstrate this impact.
- Market Structures: Discuss the market structures simulations (Price Discrimination and Cournot) that you played in Modules Six and Seven. Then, do the following in the project template:
- Complete Table 4.1 as a reference guide for your business partner. The table should compare the attributes of each of the four listed market structures.
- Answer the following questions in the paragraphs below the table:
- Explain what market inefficiencies derive from monopolies and monopolistic competition. Use examples from the textbook to support your claims.
- How do firms in an oligopolistic market set their prices? Use specific examples from the simulations or from the textbook to support your claims.
- Explain how firms that compete in the four different market structures determine profitability. Use specific examples from the simulations or the textbook to support your claims.
- Conclusions: Draw your overall conclusions about the relevance and significance of microeconomics. How will microeconomics principles impact your business decisions moving forward? Provide recommendations to your business partner for your future business venture.
- Finally, ensure that all of your sources are properly cited using in-line citations and references according to APA format.