Market Simulation – Marketing Plan
Executive Summary
Need help with your assignment? Get in touch with us.
The purpose of this paper is to create a marketing plan for our team’s business. The marketing plan highlights the necessary steps that should be used to ensure that the forecasted sales are achieved. The marketing plan for each of the three products is considered, and how it is applied in the five markets selected. Specifically, the plan reviews the previous year’s financial and market performance, current market situation, strategy for the next fiscal period, financial projections, and a tactical plan.
Financial and Market Performance Review
The previous financial and market performance of the business was not good. Notably, this is so because the three brands were new in the market. Further, the marketing efforts undertaken by the business were not successful due to budget constraints. However, since it was the first year of entering the market, the low performance is justified. It forms the basis for year two estimates that run from quarters 5 to 8.
Current Market Situation Assessment
The company’s three brands are offered in five different markets: Paris, Beijing, New York, Tokyo, and London. The markets have different characteristics, which explain the difference in pricing for each market. However, Brand A performs better in Beijing than in other markets. Brands B and C perform better in New York as compared to the other markets. Notably, this offers insight into which significant marketing efforts should be directed for each brand. Currently, the business is in a better position to pursue its marketing objectives by utilizing the profits from last year. Further, since evaluation is being done quarterly, it will be easier to make strategy amendments to the current plan before anything goes out of hand. The following table offers insight into various market aspects.
| Particular | Description |
| Customers | Customers served by the business have different tastes and preferences that are considered in market segmentation. Each customer segment is given specific attention in terms of marketing and pricing. |
| Competitors | The current market landscape is highly competitive. There are many market participants due to freedom of entry and exit. However, our business pays attention to product differentiation and competitive pricing to cope with market competition. |
| Strengths and weaknesses | Strengths
1. Strong market presence 2. Focused leadership 3. Affordable product prices Weaknesses 1. High competition 2. Financial constraints |
| Opportunities/Problems | The continued population increase in the targeted markets offers an opportunity for more sales going into the future. However, mechanisms to cope with competitive threats will be necessary. |
Marketing Strategy for the Next Year
The marketing strategy for Brand A will entail a multi-channel advertising strategy. The prices of the brand will be communicated in the advertisement and attracted consumers will place their orders. For Brand B, social media marketing will be adopted. Notably, this will entail creating social media sites for the product upon which orders for the product will be received at the quoted prices. Lastly, Brand C will be sold through a multi-channel approach. However,
social media influencers will be relied upon more than others, with most being contacted
to promote the product. A commission will be paid to them on all orders received through them.
Pro Forma Financial Projections
Tactical Plan
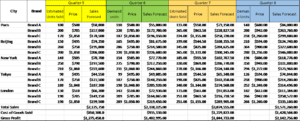
The tactical plan for each market will be developed on an ad hoc basis. Notably, this is done by creating a plan that responds to prevailing circumstances in the market (Ingram et al., 2019). However, the start of quarter five will require more sales staff for Brand A in Beijing, followed by New York, while the other three will have a similar number of staff members. Going into quarter 7, one branch of the business will be opened for every market. Notably, this is so because projections indicate that more sales will be made from that quarter, which will require more support staff. The same will be repeated after quarter eight if the projections made are achieved. Increasing staff adds to the expenses of the company in terms of the cost of goods sold and operating expenses. However, when compared with the generated profits, the expenses are worth incurring.
| City | Brand | Quarter 5 | Quarter 6 | Quarter 7 | Quarter 8 | ||||||||
| Estimated Units Sold | Price | Sales Forecast | Estimated Units Sold | Price | Sales Forecast | Estimated Units Sold | Price | Sales Forecast | Estimated Units Sold | Price | Sales Forecast | ||
| London | Brand X | 50 | $ 995 | $ 49,750 | 70 | $ 975 | $ 68,250 | 105 | $ 965 | $ 101,325 | 135 | $ 965 | $ 130,275 |
| Brand Y | 260 | $ 675 | $ 175,500 | 255 | $ 699 | $ 178,245 | 240 | $ 699 | $ 167,760 | 210 | $ 699 | $ 146,790 | |
| Paris | Brand X | 70 | $ 980 | $ 68,600 | 130 | $ 1,095 | $ 142,350 | 165 | $ 1,125 | $ 185,625 | 205 | $ 1,149 | $ 235,545 |
| Brand Y | 210 | $ 650 | $ 136,500 | 260 | $ 629 | $ 163,540 | 330 | $ 599 | $ 197,670 | 405 | $ 599 | $ 242,595 | |
| Brand Z | 150 | $ 1,299 | $ 194,850 | 175 | $ 1,349 | $ 236,075 | 210 | $ 1,399 | $ 293,790 | ||||
| Total Sales | $ 430,350 | $ 747,235 | $ 888,455 | $ 1,048,995 | |||||||||
| City | Brand | Quarter 5 | Quarter 6 | Quarter 7 | Quarter 8 | ||||||||
| Estimated Units Sold | Price | Sales Forecast | Demand units | Price | Sales Forecast | Estimated Units Sold | Price | Sales Forecast | Demand Units | Price | Sales Forecast | ||
| Paris | Brand A | 100 | $500 | $50,000 | 110 | $500.00 | $55,000.00 | 133.00 | $550.00 | $73,150.00 | 140 | $600.00 | $84,000.00 |
| Brand B | 200 | $785 | $157,000 | 220 | $785.00 | $172,700.00 | 265.00 | $863.50 | $228,827.50 | 280 | $942.00 | $263,760.00 | |
| Brand C | 170 | $1,050 | $178,500 | 187 | $1,050.00 | $196,350.00 | 224.00 | $1,155.00 | $258,720.00 | 238 | $1,260.00 | $299,880.00 | |
| Beijing | Brand A | 150 | $495 | $74,250 | 165 | $495.00 | $81,675.00 | 199.00 | $544.50 | $108,355.50 | 210 | $594.00 | $124,740.00 |
| Brand B | 260 | $750 | $195,000 | 286 | $750.00 | $214,500.00 | 345.00 | $825.00 | $284,625.00 | 364 | $900.00 | $327,600.00 | |
| Brand C | 200 | $1,030 | $206,000 | 220 | $1,030.00 | $226,600.00 | 265.00 | $1,133.00 | $300,245.00 | 280 | $1,236.00 | $346,080.00 | |
| New York | Brand A | 140 | $505 | $70,700 | 154 | $505.00 | $77,770.00 | 185.00 | $555.50 | $102,767.50 | 196 | $606.00 | $118,776.00 |
| Brand B | 250 | $790 | $197,500 | 275 | $790.00 | $217,250.00 | 330.00 | $869.00 | $286,770.00 | 350 | $948.00 | $331,800.00 | |
| Brand c | 210 | $1,060 | $222,600 | 231 | $1,060.00 | $244,860.00 | 278.00 | $1,166.00 | $324,148.00 | 294 | $1,272.00 | $373,968.00 | |
| Tokyo | Brand A | 90 | $495 | $44,550 | 99 | $495.00 | $49,005.00 | 120.00 | $544.50 | $65,340.00 | 126 | $594.00 | $74,844.00 |
| Brand B | 170 | $750 | $127,500 | 187 | $750.00 | $140,250.00 | 198.00 | $825.00 | $163,350.00 | 238 | $900.00 | $214,200.00 | |
| Brand C | 180 | $1,040 | $187,200 | 198 | $1,040.00 | $205,920.00 | 240.00 | $1,144.00 | $274,560.00 | 252 | $1,248.00 | $314,496.00 | |
| London | Brand A | 130 | $510 | $66,300 | 143 | $510.00 | $72,930.00 | 173.00 | $561.00 | $97,053.00 | 182 | $612.00 | $111,384.00 |
| Brand B | 190 | $785 | $149,150 | 209 | $785.00 | $164,065.00 | 251.00 | $863.50 | $216,738.50 | 266 | $942.00 | $250,572.00 | |
| Brand C | 190 | $1,050 | $199,500 | 209 | $1,050.00 | $219,450.00 | 251.00 | $1,155.00 | $289,905.00 | 266 | $1,260.00 | $335,160.00 | |
| Total Sales | $2,125,750 | $2,338,325.00 | $3,074,555.00 | $3,571,260.00 | |||||||||
| Cost of Goods Sold | $850,300.0 | $935,330.00 | $1,229,822.00 | $1,428,504.00 | |||||||||
| Gross Profit | $1,275,450.0 | $1,402,995.00 | $1,844,733.00 | $2,142,756.00 | |||||||||
| Operating Expenses | $637,725.0 | $701,497.50 | $922,366.50 | $1,071,378.00 | |||||||||
| Net profit | $637,725.0 | $701,497.50 | $922,366.50 | $1,071,378.00 | |||||||||
| Cumulative net profit | $637,725.0 | $1,339,222.50 | $2,261,589.00 | $3,332,967.00 | |||||||||
Reference
Ingram, T. N., LaForge, R. W., Avila, R. A., Schwepker Jr, C. H., & Williams, M. R. (2019). Sales management: Analysis and decision making. Routledge.
ORDER A PLAGIARISM-FREE PAPER HERE
We’ll write everything from scratch
Question 
Market Simulation – Marketing Plan
The purpose of this assignment is to create a marketing plan.
As your team continues to proceed through each quarter of the Marketplace Simulation, it is essential to prepare an outline for your marketing plan. In a 500-750-word document, include the following:
Executive Summary
Review of Financial and Market Performance During Previous Year
Assessment of Current Situation and the Market
Create a table that represents the items listed below:
Customers
Competition
Company’s strengths and weaknesses
Major problems/opportunities to be addressed in the following year
Marketing Strategy for the Next Year in the Business (What will it take to get ahead or stay ahead?)
Brand strategy
Pricing strategy
Advertising strategy
Sales channel
Pro Forma Financial Projections (Excel spreadsheet for Quarters 1-8)
Copy the pro forma in the simulation for Quarters 1-4 into Excel and add information/data for Quarters 5-8.
Tactical Plan (Quarters 1-8)
The tactical plan should articulate what is planned for each quarter. For example, Q6-open three offices in Paris, London, and New York. Each office will staff five employees, one service, and four sales personnel, with two sales staff for priority 1 and 2 target markets, at a determined cost. The reader should then be able to see the cost entry on the pro forma. Every planned expenditure shown on the pro forma should include an explanation of the tactical plan. Revenue should reflect the projected number of units, the price of each, and the cost of goods sold.