Lab 4 – Thermochemistry
Name: [First and Last]
Date: MM/DD/YYY
Experiment #:4
Title: Thermochemistry
Purpose:
This experiment aims to use a calorimeter to study how heat is exchanged in acid-base chemical reactions. The heat change in the burning of a hydrocarbon fuel will also be measured using a different calorimeter. The student’s understanding of heat transmission in chemical reactions will be strengthened by this experiment, which will give them practical calorimetry experience.
Procedure:
- Determining Heat Capacity of the Calorimeter
- Measure 50ml of tap water
- Measure the initial temperature of tap water using a thermometer
- Measure 50ml of warm water (warm it to around 40 o C)
- Using a thermometer, measure the temperature of warm water
- Mix both warm water and tap water in the calorimeter
- Measure the temperature of both after the mix after every 15 seconds up to 3 minutes
- Acid-Base Reaction Curve
- Measure 50ml of HCl and add put it in the calorimeter
- Measure the temperature (initial temperature) of the HCl using the thermometer
- Measure 50ml of NaOH and measure its initial temperature before mix
- Add NaOH to the calorimeter to react with HCl
- Record the temperature after the reaction after 15 seconds up to 3 minutes
- Combustion of Hydrocarbon Fuel
- Measure the mass of the fuel (initial mass before burning)
- Measure 500ml of water using a graduated beaker
- Measure the initial temperature of the water
- Measure the mass of the pan
- Put water into the pan on a stand
- Put the fuel under the pan and light it
- Allow fuel to heat the water for 10 minutes
- Measure the mass (final) of the fuel after burning
- Measure the temperature (final) of water after heating
Data/Results/Calculations:
- Determining Heat Capacity of the Calorimeter
- The initial temperature of tap water = 22.5oC
- The initial temperature of warm water = 38oC
- The high temperature of the mixture = 30oC
- Change in the temperature of tap water = 30 – 22.5oC = 7.5oC
- Change in the temperature of warm water 38.0oC – 30.0oC = 8.0oC
- Heat gained by tap water : 7.5oC x 50g x4.18Kj/k– g = 1567.5 J
- Heat gained by warm water 8.0oC x 50g x 4.18 Kj/k– g = 1672 J
- Heat capacity of the calorimeter: 1567.5 J – 1672 J = 13.9 J/K
- Acid-Base Reaction Enthalpy Change
- Initial of HCl in the calorimeter = 22.8oC
- Highest temperature = 28.6oC
- Change in temperature = 5.8oC
- Heat gained by the solution = 5.8oC × 100g × 4.18 Kj/k– g = 2424.4 J
- Heat gained by the calorimeter: 5.8oC × 13.9 J/K = 80.6 J
- Total heat gained = 80.6 J + 2424.4 J = 2505 J
- Combustion of Hydrocarbon Fuel
Fuel Heat Value = 6020 cal/g
- The initial mass of fuel (Hydrocarbon) = 203.2382g
- The final mass of fuel = 200.244g
- Change in the mass of fuel = 3.0138g
- Initial water temperature = 21.4 o C
- Final water temperature = 37.2 o C
- Change in temperature = 15.8oC
- Mass of water: 500 ml × 1g/1ml = 500g
- Mass of the pan = 218.87g
Overall Heat Change = (mass of water × heat capacity of water) + (mass of the pan × heat capacity of the pan) × Change in temperature of water/Change in the mass of fuel
- (500g × 100 cal/g-0 C) + (218.87g x 0.092 cal/g-0 C) × 15.8 0 C = 8218.1 cal/3.0138g
- = 2726.8cal/g
- Theoretical accepted value = 6020 cal/g
- Lab calculated value (actual) = 8cal/g
- % efficiency = actual/theoretical × 100
- = 2726.8cal/g/6020 cal/g × 100 = 45.3 %
- % efficiency = actual/theoretical × 100
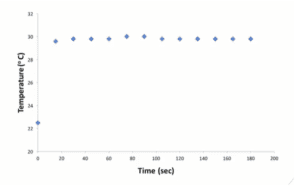
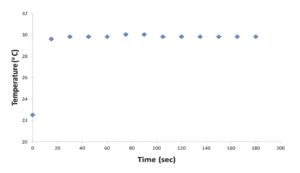
- Graph and Table: The Heat Capacity of the Calorimeter
Graph 1: The Heat Capacity of the Calorimeter
| Time (seconds) | Temperature (oC) |
| 0 | 22.5 |
| 15 | 29.6 |
| 30 | 29.8 |
| 45 | 29.8 |
| 60 | 29.8 |
| 75 | 30.0 |
| 90 | 30.0 |
| 105 | 29.8 |
| 120 | 29.8 |
| 135 | 29.8 |
| 150 | 29.8 |
| 165 | 29.8 |
| 180 | 29.8 |
Table 1: The Heat Capacity of the Calorimeter
- Graph and Table: Acid-Base Reaction Heat Curve
Graph 2: Acid-Base Reaction Heat Curve
| Time (seconds) | Temperature (oC) |
| 0 | 22.8 |
| 15 | 28.0 |
| 30 | 28.6 |
| 45 | 28.6 |
| 60 | 28.6 |
| 75 | 28.6 |
| 90 | 28.6 |
| 105 | 28.4 |
| 120 | 28.4 |
| 135 | 28.4 |
| 150 | 28.4 |
| 165 | 28.4 |
| 180 | 28.4 |
Table 2: Acid-Base Reaction Heat Curve
Conclusions:
In conclusion, this experiment successfully achieved its goal of employing calorimetry to investigate heat transfer during chemical reactions. As such, the experiment gave me practical experience and increased my understanding of heat transport in chemical reactions using a calorimeter. A calorimeter was used to measure the heat change caused by the combustion of hydrocarbon fuel. Overall, the experiment was valuable in learning more about calorimetry and offered insightful information about the subject.
Notes:
Life is greatly impacted by thermochemistry. Thermodynamic concepts underlie energy changes, including metabolism and cellular respiration. It fuels the generation of heat and electricity, both of which are necessary for human comfort and the growth of technology. The synthesis of materials, fuels, and medications is also made possible by thermochemical reactions, improving the quality of life and access to medical care.
ORDER A PLAGIARISM-FREE PAPER HERE
We’ll write everything from scratch
Question

Lab 4 – Thermochemistry
An experienced instructor will conduct this lab. As you watch the lab, you should keep a lab notebook just as you would if you were personally conducting the lab. A well-kept lab notebook is the key to successful labs. The lab notebook acts as the record of your experiment, help you organize your thoughts and understand the results of the experiment, and will be useful in writing your lab report. Your lab notebook and/or lab report can be used as you take the lab exam that accompanies each experiment.
To complete the lab report requirement, be sure to follow the “Lab Report Sample” as your model and type out your lab report using the “Lab Report Template.” These can be found under “Lab Overview”. You can upload your report by clicking “Submit,” and then attaching your document.


