Lab 3 – Quantitative Analysis
Name: [First and Last]
Date: MM/DD/YYYY
Experiment #: 3
Title: Quantitative Analysis
Purpose:
The objective of this experiment is to conduct a quantitative chemical analysis of metallic carbonate and a hydrate. Hydrate analysis will determine the percentage of water present, aiding in the identification of the metal hydrate. Additionally, paper chromatography will be employed to identify the elements of Aspartame, an artificial sweetener. Also, Electron microscopy for scanning will be utilized to qualitatively analyze different materials and identify the elemental composition of two unknown substances. Completing these experiments will help one gain knowledge on how to identify of chemical elements in a compound.
Procedure:
- Quantitative Analysis
- Analysis of carbonate
- Place the test tube and beaker on the weighing balance.
- Fill the beaker with excess sulfuric acid and 1 gram of metal carbonate.
- Mix and observe the changes after the reaction.
- After the reaction, measure the mass of the metal carbonate to obtain the lost mass.
- Hydrate analysis
- Place the crucible on the balance
- Put hydrate into the crucible
- Measure the weight of the hydrate
- Heat the hydrate using the Bunsen burner for 10 minutes
- After heating, put the crucible into the desiccator to cool and prevent any water from being picked up by the hydrate.
- Close the desiccator as the crucible cools for 10 minutes.
- Transfer the crucible to the balance to measure the weight lost after heating.
- Qualitative Analysis
- Paper chromatography
- Put the cylindrical porous paper into the mobile phase in the beaker- the paper is labeled with different Amino Acids.
- Cover the beaker using Aluminium foil
- Wait for 1 hour as the mobile phase moves up the paper
- Remove the paper from the beaker
- Unfold the paper to measure the distance that the samples have moved
- Spray the chromatogram using Ninhydrin
- Note: Ninhydrin reacts with colorless Amino Acids to form colored pigments
- Measure the distance of each Amino Acid after coloration.
- Scanning Electron Microscopy
- Apply the sample on the carbon adhesive tape
- Next, put it on a pad in a sputter coat chamber
- Mount carbon rods in the sputter coat chamber
- Note: carbon rods are the source of carbon
- Create a vacuum in the sputter coat chamber and put it on
- Open the chamber to make observations on the sample
- Remove the sample from the sputter coater
- Insert the sample in the SEM/EDX
- Create the vacuum in the SEM/EDX from the monitor
- Observe the sample in the SEM/EDX using the monitor displaying the screen
Data/Results/Calculations:
- Quantitative Analysis
- Carbonate analysis reaction
MCO3 + H2SO4 → M+n + SO4 -2 + H2O + CO2
CO2 is given off in the reaction
Carbonate Analysis
% CO₂ in the sample: (Weight Loss / Sample Weight) x 100
% CO₂ = (0.7033 / 1.1809) x 100 = 59.56 %
| Compound | Molecular Weight | % CO2 Calculation |
| CaCO3 | 100.09 | 44.01/100.09 = 43.97% |
| K2CO3 | 138.21 | 44.01/138.21 = 31.84% |
| Na2CO3 | 105.99 | 44.01/105.99 = 41.52% |
| Li2CO3 | 73.892 | 44.01/72.892 = 59.56% |
Carbon (iv) Oxide that was lost in the experiment equals that of Lithium carbonate Therefore, the unknown carbonate is Lithium carbonate.
-
Analysis of Hydrate
Hydrate analysis reaction
MX . nH2O + H2O → MX + nH2O
nH2O is given off in the reaction
% H₂O in the sample: (Weight Loss ÷ Sample Weight) × 100
% H₂O = 0.3748/2.4406 × 100 = 15.36 %
| Compound | Molecular Weight | % H₂O Calculation |
| AICI3. 6H₂O | 241.43 | 108.096/241.43 = 44.77% |
| MgCl₂.6H₂O | 203.301 | 108.096/203.301 = 53.17% |
| Na₂CO₂.10H₂O | 286.15 | 180.16/286.15 = 62.96% |
| BaCl2.2H2O | 244.462 | 36.032/244.462 = 14.74% |
Water that was lost in the experiment equals that of hydrated Barium chloride, so hydrated unknown hydrate is Barium chloride.
-
Qualitative Analysis
- Paper Chromatography
Chromatography is a method for dissolving mixtures into their constituent parts so that the mixture or its constituent parts can be examined or identified. A mobile phase is used in chromatography, and it passes over or through a stationary phase. The separation of the mixture into its constituent parts is made possible by the varied affinities of the mixture elements for either the stationary or mobile phase. As a result, each component moves at a different rate. The paper serves as the stationary phase in the paper chromatography process, and the liquid that moves up the paper’s surface during the mobile phase is dragged upward through capillary forces.
- Calculation of Amino Acid Rf Values
Rf = Distance covered by amino acid/Distance covered by the mobile phase
- Aspartate = 18 milmeter / 74 milmeter = 0.243
- Histidine = 22 milmeter / 74 milmeter = 0.297
- Leucine = 55 milmeter / 74 milmeter = 0.743
- Phenylalanine = 51 milmeter / 74 milmeter = 0.689
- Proline = 33 milmeter / 74 milmeter = 0.446
- Calculation of Aspartame Rf values
Rf = Distance covered by the component/Distance covered by the mobile phase
- Rf (component one) = 21 milmeter / 74 milmeter = 0.283
- Ideal match with Rf value/color of Aspartate = 0.243
- Rf (component two) = 50 milmeter / 74 milmeter = 0.676
- Ideal match with Rf value of Phenylalanine = 0.689
- Aspartic acid + Phenylalanine = Aspartame
- Scanning Electron Microscopy
With the help of a concentrated electron beam, a sample is scanned by a scanning electron microscope (SEM). The interactions between the electrons and the sample reveal the sample’s surface characteristics and elemental makeup, which also result in signals. Normal optical microscopes magnify items to smaller sizes. However, SEMs may magnify objects up to 300,000 times their size.
-
Preparing samples for SEM/EDX Spectroscopy
Sputter coating
In scanning electron microscopy, the sample is coated with a thin, random layer of conductive substance to make it conductive and stop the specimen from being charged by the electromagnetic field. Carbon coatings are frequently used in EDX spectroscopy, especially for specimens with low atomic numbers.
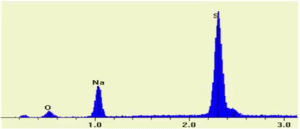
SEM/EDX Spectrum of Sodium Sulfate (Na2SO4)
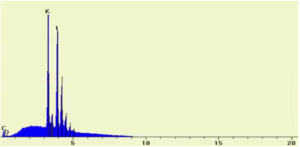
SEM/EDX Spectrum of Potassium Iodide (KI)
SEM/EDX Spectrum of Asprin (HOOCC6H4COCH3)
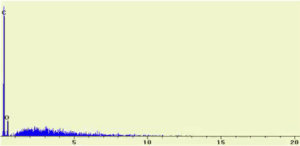
SEM/EDX Spectrum of unknown #1
Which of the following is the formula of unknown #1:
- C9H8O4
- C7H7NO
- C7H5OBr
The elements C, N, and O are visible in the SEM/EDX spectrum.
Therefore, Unknown #1 is C7H7NO because it is the only substance to have C, N, and O.
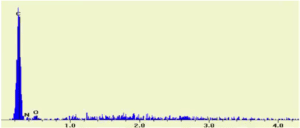
SEM/EDX Spectrum of unknown #2
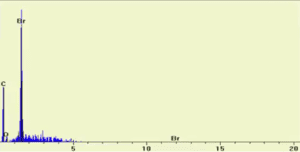
Which of the following is the formula of unknown #1:
- C9H8O4
- C7H7NO
- C7H5OBr
The elements C, O, and Br are visible in the SEM/EDX spectrum.
Therefore, Unknown #2 is C7H5OBr as it is the only substance to have C, O, and Br.
Conclusion
In conclusion, the goals of the experiment were achieved successfully, as I gained the knowledge and skills to perform quantitative chemical analysis and the identification of chemical compounds. The assay of the metal carbonate and hydrate enabled the quantitative determination of water content, aiding in the identification of the metal hydrate. Paper chromatography effectively identified the amino acid components of Aspartame, providing insight into its composition. Additionally, Scanning Electron Microscopy enabled qualitative analysis and elemental identification of two unknown substances. Overall, the experiment provided valuable skills and an enhanced understanding of chemical analysis techniques.
Notes
Chemical analysis plays a crucial role in the chemistry lab for several reasons. It helps identify and quantify substances in a sample, ensuring accuracy and reliability in experiments and research. It enables the determination of chemical composition, purity, and properties of substances. Chemical analysis also aids in quality control, troubleshooting, and developing new materials and processes.
ORDER A PLAGIARISM-FREE PAPER HERE
We’ll write everything from scratch
Question 
Lab 3 – Quantitative Analysis
An experienced instructor will conduct this lab. As you watch the lab, you should keep a lab notebook just as you would if you were personally conducting the lab. A well-kept lab notebook is the key to successful labs. The lab notebook acts as the record of your experiment, helps you organize your thoughts and understand the experiment’s results and is useful for writing your lab report. Your lab notebook and/or lab report can be used as you take the lab exam that accompanies each experiment.
To complete the lab report requirement, be sure to follow the “Lab Report Sample” as your model and type out your lab report using the “Lab Report Template”. These can be found under “Lab Overview”. You can upload your report by clicking “Submit,” and then attaching your document.