Homework 1
Descriptive Statistics for Phishing and Ransomware Attacks
| Phishing and Ransomware Attempts | ||
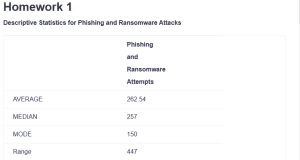
| AVERAGE | 262.54 | |
| MEDIAN | 257 | |
| MODE | 150 | |
| Range | 447 | |
| Variance | 17203.0284 | |
| Standard Deviation | 131.1603156 | |
| Interquartile Range (IQR): | 219.5 | |
| Skewness | 0.177689547 | |
| Kurtosis | -1.180374771 | |
| Percentiles (example for the 90th percentile) | 454.1 | |
| Quartiles | 148.75 | 368.25 |
| Count | 200 | |
| Min | 52 | |
| Max | 499 | |
| Sum | 52508 | |
| Coefficient of Variation (CV) | 0.499582218 |
By Industry
| Consulting | Education | Energy | Financial Services | Healthcare | Legal Services | Manufacturing | Media and Marketing | Retail | Technology | |
| AVERAGE | 271.85 | 294.3 | 219.85 | 277.2 | 253.25 | 276.5 | 275.8 | 260.3 | 223.1 | 273.25 |
| MEDIAN | 261 | 280 | 187.5 | 269 | 263 | 290.5 | 267.5 | 246.5 | 215.5 | 280.5 |
| MODE | 140 | #N/A | #N/A | #N/A | #N/A | #N/A | #N/A | 257 | #N/A | #N/A |
| Range | 434 | 356 | 391 | 446 | 401 | 379 | 413 | 331 | 390 | 419 |
| Variance | 25515.7275 | 13989.11 | 16741.03 | 18573.96 | 15903.888 | 13413.55 | 19818.36 | 10537.71 | 15345 | 16926.7875 |
| Standard Deviation | 159.7364313 | 118.2756 | 129.3871 | 136.2863163 | 126.11062 | 115.8168813 | 140.7776971 | 102.6533487 | 123.9 | 130.102988 |
| Interquartile Range (IQR): | 307.75 | 167.25 | 234 | 236.75 | 187.25 | 202.75 | 205.75 | 152.25 | 193.8 | 199 |
| Skewness | 0.106943155 | 0.445635 | 0.389781 | 0.027781832 | 0.2073887 | -0.064699517 | 0.310477234 | 0.447182603 | 0.475 | -0.24855839 |
| Kurtosis | -1.793676496 | -1.13949 | -1.35507 | -1.324217758 | -0.8453558 | -1.277438254 | -1.230469554 | -0.920121063 | -0.95 | -1.14949136 |
| Percentiles (example for the 90th percentile) | 482.9 | 478.1 | 388.4 | 466 | 427.8 | 413.7 | 495.2 | 416 | 417.7 | 425.3 |
| Quartiles | 130.5 | 205 | 105.25 | 155.5 | 137.25 | 172.5 | 153.5 | 185.5 | 102 | 167.25 |
| Count | 20 | 20 | 20 | 20 | 20 | 20 | 20 | 20 | 20 | 20 |
| Min | 65 | 136 | 63 | 52 | 80 | 98 | 85 | 114 | 65 | 61 |
| Max | 499 | 492 | 454 | 498 | 481 | 477 | 498 | 445 | 455 | 480 |
| Sum | 5437 | 5886 | 4397 | 5544 | 5065 | 5530 | 5516 | 5206 | 4462 | 5465 |
| Coefficient of Variation (CV) | 0.587590331 | 0.401888 | 0.588525 | 0.491653378 | 0.4979689 | 0.418867564 | 0.510434 | 0.394365535 | 0.555 | 0.4761317 |
By Company
| Cyberconsult | EduGlobal | FinTrust Bank | Green Energy | HealthFirst | LawShield LLP | Manufex Corp. | MediaHub | RetailPro | TechSecure | |
| AVERAGE | 271.85 | 294.3 | 219.85 | 277.2 | 253.25 | 276.5 | 275.8 | 260.3 | 223.1 | 273.25 |
| MEDIAN | 261 | 280 | 187.5 | 269 | 263 | 290.5 | 267.5 | 246.5 | 215.5 | 280.5 |
| MODE | 140 | #N/A | #N/A | #N/A | #N/A | #N/A | #N/A | 257 | #N/A | #N/A |
| Range | 434 | 356 | 391 | 446 | 401 | 379 | 413 | 331 | 390 | 419 |
| Variance | 25515.7275 | 13989.11 | 16741.03 | 18573.96 | 15903.888 | 13413.55 | 19818.36 | 10537.71 | 15345 | 16926.7875 |
| Standard Deviation | 159.7364313 | 118.2756 | 129.3871 | 136.2863163 | 126.11062 | 115.8168813 | 140.7776971 | 102.6533487 | 123.9 | 130.102988 |
| Interquartile Range (IQR): | 307.75 | 167.25 | 234 | 236.75 | 187.25 | 202.75 | 205.75 | 152.25 | 193.8 | 199 |
| Skewness | 0.106943155 | 0.445635 | 0.389781 | 0.027781832 | 0.2073887 | -0.064699517 | 0.310477234 | 0.447182603 | 0.475 | -0.24855839 |
| Kurtosis | -1.793676496 | -1.13949 | -1.35507 | -1.324217758 | -0.8453558 | -1.277438254 | -1.230469554 | -0.920121063 | -0.95 | -1.14949136 |
| Percentiles (example for the 90th percentile) | 482.9 | 478.1 | 388.4 | 466 | 427.8 | 413.7 | 495.2 | 416 | 417.7 | 425.3 |
| Quartiles | 130.5 | 205 | 105.25 | 155.5 | 137.25 | 172.5 | 153.5 | 185.5 | 102 | 167.25 |
| Count | 20 | 20 | 20 | 20 | 20 | 20 | 20 | 20 | 20 | 20 |
| Min | 65 | 136 | 63 | 52 | 80 | 98 | 85 | 114 | 65 | 61 |
| Max | 499 | 492 | 454 | 498 | 481 | 477 | 498 | 445 | 455 | 480 |
| Sum | 5437 | 5886 | 4397 | 5544 | 5065 | 5530 | 5516 | 5206 | 4462 | 5465 |
| Coefficient of Variation (CV) | 0.587590331 | 0.401888 | 0.588525 | 0.491653378 | 0.4979689 | 0.418867564 | 0.510434 | 0.394365535 | 0.555 | 0.4761317 |
Overall Summary
The descriptive statistical analysis of phishing and ransomware attacks can be used to assess the cybersecurity landscape of different industries and companies. Examining metrics like average, median, mode, range, variance and standard deviation, interquartile range, skewness, kurtosis, percentiles, quartiles, count, min, max, sum, percent sum, and coefficient of variation allows one to identify trends, assess risk, derive statistics, see the outliers, and compare attack prevalence and impact.
When comparing phishing attempts by industry, it is apparent that the education sector has the most, with an average of 294.3, financial services with an average of 277.2, and legal services with an average of 276.5. The energy sector, however, has the lowest average phishing attempts at 219.85. The results showed that industries involving sensitive personal or financial information seemed to fall under categories more prominently targeted by phishing attacks. Organizations within these sectors should focus tremendously on employee training and have proper safeguards in email security to prevent phishing attempts from materializing. EduGlobal topped the list in average ransomware attempts by company at 294.3, following the claim made in the education industry. FinTrust Bank’s average of 277.2 is relatively high, as is TechSecure Inc.’s at 273.25. Again, the industry-level analysis is confirmed when Green Energy shows the lowest average ransomware attempts at 219.85. All these show that companies must spend on full cybersecurity solutions—data backups, endpoint protection, incident response plans—to resist possible ransomware attacks.
Variance, standard deviation, and coeffective variation are important metrics to estimate the spread and distribution of attempts. Phishing attempts have the highest variance at 25515.7275 and the highest standard deviation at 159.7364313, implying that their spread is wider than other spreads. For ransomware attempts, Green Energy exhibits the highest coefficient of variation of 0.588525, with greater variability relative to its mean. Gauging what is good for a company needs to start by thinking about the industry as only a small part of the equation. These findings reinforce the need to extrapolate cybersecurity strategies toward company and industry-specific needs.
Outliers or skewed distribution can be detected through interquartile range (IQR) and skewness. Phishing attempts have the highest IQR at 307.75, implying a higher middle 50% range in the consulting industry. In general, most industries and companies have slightly positive skewness, but it mostly indicates a longer tail toward higher attempt values. Legal services and TechSecure Inc. have slight negative skewness for ransomware attempts, however. These insights can provide organizations with a means to find and solve potential outliers/anomalies in their cybersecurity data.
A glance through phishing and ransomware attack rates shows that phishing attempts tend to have a higher overall average rate (262.54) than ransomware attempts (220.45 over a month). Phishing attempts also have a higher range and variance, suggesting greater variability and spread are observed in phishing. However, there is a larger relative variability, with the coefficient of variation of ransomware attempts being higher (0.542) than the coefficient of variation of phishing attempts (0.499). Both types of attacks are organizational risks that organizations must be vigilant against and resource accordingly based on risk assessment.
Furthermore, the number of attempts is not sufficient to estimate the risk; however, the result of these attacks in terms of success rate and associated monetary loss should also be taken into account. Higher average attempts in industries and companies such as education and financial services may be at more risk. Nevertheless, if the industry average is low, the company may still be at significant risk if it has high success rates or if losing one attack has a high monetary consequence. Effective risk management requires regularly monitoring key performance indicators (number of successful attacks, time to detect and time to respond, and the financial impact).
In conclusion, this statistical analysis demonstrates the prevalence of phishing and ransomware in industries and companies. Although education and financial services seem to be more heavily targeted, no industry is immune. In metrics of the number of attempts (such as variance, standard deviation, or coefficient of variation), one can see the variability in attempting these threats. Using these statistical insights, organizations can get a sense of their risk profile, how resources can be most effectively and appropriately used, and determine which cybersecurity measures will prove most efficacious in helping reduce the impact of phishing and ransomware attacks. With an ever-more digital landscape, regular monitoring and analysis of cybersecurity data remains vital in maintaining the upper edge in the continuous struggle against ever-evolving threats. Building a more resilient and secure future will require ongoing investment in cybersecurity research, innovation, and collaboration within and across industries.
ORDER A PLAGIARISM-FREE PAPER HERE
We’ll write everything from scratch
Question 
HW1
Attached Files: Phishing_Data_HW_Excel.xlsx (70.059 KB)
Phishing_Ransomware_Data.xlsx (12.358 KB)
gwu_sdv_week1_oh_friday.ipynb (790.142 KB)
Phishing_Data.xlsx (5.846 KB)
no_mark_but_recommended.xlsx (22.306 KB)
Homework 1 Instructions
The task for Homework 1 was thoroughly explained during the office hour, and the session was recorded for your convenience. You can access the recording here:
However, it is crucial to carefully read the following instructions to ensure you secure full marks:
1 . Excel Task
o You must complete the Excel file provided as part of this assignment. This will demonstrate your clear understanding of descriptive statistics,as well as proficiency
in Excel formulas and basic charts.
o The file you need to fill is Phishing_Data_HW_Excel.xlsx. This will be marked, so please ensure all sections are thoroughly completed.
1. Python Task:
o After completing the Excel task, you will repeat the same analysis using Python. To do this:
o Open thejupyter notebook gwu_sdv_week1_oh_friday.ipynb in Google Colab.
o Upload the files Phishing_Data.xlsx and Phishing_Ransomware_Data.xlsx into the Colab environment, and run the notebook. It’s essential that you understand the code provided.
o This is a critical step, as we are collectively deciding whether to use Python as the primary tool for homework assignments, with Minitab as optional. To assess your readiness, an additional file no_mark_but_recommended.xlsx has been provided.
2. Extended Python Task (Highly Recommended):
o The file no_mark_but_recommended.xlsx includes data on four types of cyberattacks instead of two (as in the original Python notebook). Your task is to extend the existing Python code to handle the additional attack types and reproduce the results for all four.
o This part of the assignment is optional but strongly recommended. If you skip this, I will not accept later suggestions to avoid using Python for future assignments.
o Completing this task will demonstrate your ability to work with Python and adapt to extended datasets. Please upload the updated version of this file as part of your submission to ensure we are confident in the class‘s overall readiness for Python–based assignments.
Homework 1
Summary of Required Actions:
• Mandatory: Complete the Phishing_Data_HW_Excel.xlsx file for marking.
• Highly Recommended: Extend the Python code using no_mark_but_recommended.xlsx and submit the file to demonstrate proficiency in Python.
If you have any questions, refer back to the recorded office hour or reach out for further clarification.
Good luck, and I look forward to your submissions!
Important Note on GenAI:
• GenAI is allowed! While the use of Python is an important aspect of this course, Python programming skills will not be the focus of your evaluation. Instead, what matters most is your statistical understanding, your ability to tell a clear and compelling story with data, and the quality of your writing. These will be the key factors in your assessment throughout the course.
Best,
ProfT