Economic Summary Report
For the benefit of the incoming administration, I submit this report to document, analyze, and interpret the macroeconomic policy decisions I made as the chief economic policy advisor of Econland. The purpose of this document is to further our national prosperity by deepening our understanding of the relationship between macroeconomic policies and their consequences for our citizens. The report includes a thorough accounting of the major fiscal and monetary policy decisions made over each of the seven years of my term, as well as an explanation of the underlying rationales for those decisions and the resulting impacts of those policies.
Table 1: Econland’s Macroeconomic Aspects
| 2015 | 2016 | 2017 | 2018 | 2019 | 2020 | |
| Population (Millions) | 44 | 44.5 | 45 | 45.7 | 46.5 | 49 |
| GDP per capita | 1,400 | 1,450 | 1,500 | 1,600 | 1,750 | 1,800 |
| GDP (USD bn) | 63 | 65 | 69 | 78 | 80 | 86 |
| Economic Growth | 5.5 | 5.7 | 5.9 | 4.8 | 6 | 6.3 |
| Investment (annual %) | 6.5 | -8 | 8 | 2 | 2.5 | 7 |
| Industrial production (annual variation %) | 7 | 4 | 3 | 5 | 4 | 6 |
| Inflation Rate (%) | 6.5 | 6 | 6.5 | 5 | 4 | 5.8 |
| Imports (USD bn) | 15.5 | 14 | 16 | 17.2 | 17.4 | 17.8 |
| Exports (USD bn) | 5.5 | 5.7 | 5.7 | 6 | 6.7 | 5 |
The table above summarizes the macroeconomic climate of Econland over my term. Econland’s economic performance shows significant improvement as it approaches 2020. A major economic growth was witnessed between 2018 and 2019. During this period, the population also grew significantly. The population of the county also grew significantly during the five-year period. Econland’s investment grew 7 percent from 2 percent in 2018 alongside industrial production. The exports reduced significantly, while the imports grew gradually. During my seven-year term, Econland posted great progress as a nation, signaling effective policies that positively affected the economy.
Fiscal Policy: Taxation
Table 2 below shows Econland’s annual growth rates in bases and tax yields from 2015 to 2020. The table shows the rapid nominal growth of VAT as private consumption also increased. Income tax revenues stagnated significantly during the 6-year period. The revenue obtained from customs shrunk considerably. The trade liberalization policies that were enacted in 2016 may have contributed to the current observations. Trade liberalization involves the elimination of trade tariffs and other barriers that hinder free trade between nations. The policy opened up Econland to international trade and encouraged investments within the nation. This non-restricted trade explains the economic growth, increased imports, and investments.
Table 2: Econland’s Tax Growth Rates
| Tax | Nominal Tax yield growth | Real tax yield growth | Proxy base | Nominal base growth | Real base growth |
| Income Tax | 0.0320 | 0.0029 | Incomes of Domestic factors | 0.0460 | 0.0145 |
| VAT | 0.0420 | 0.0090 | Private consumption | 0.0467 | 0.0153 |
| Custom Duties | 0.0080 | 0.0409 | Imports | 0.0409 | 0.0083 |
| Excise Duties | 0.0389 | 0.0063 | Private consumption | 0.0467 | 0.0153 |
| Total taxes | 0.0318 | 0.0006 | GDP | 0.0457 | 0.0130 |
This policy was backed by economic evidence of poverty minimization, the creation of competitive advantages, and the growth of developing countries’ economies. The World Bank said that the trade liberalization policy successfully reduced absolute poverty by more than 14 percent between 1993 and 1998. This data confirms that countries that seek to engage outwardly with other nations may have more consistent growth than inward-looking countries.
The increase in private consumption is a result of economic growth, as indicated in Table 1. The act of opening up Econland to other nations for trade purposes also led to an increase in personal income. The creation of new employment opportunities drastically improves the economic abilities of both skilled and unskilled citizens. As a result, the income increments lead to more spending capability, and the government accesses more revenue in the form of VAT.
The United States of America has had different tax policy decisions enacted to achieve varied objectives. For instance, the Economic Recovery Act of 1981 was created to minimize the rates of personal income tax by 23 percent. Changes in the country’s monetary policies are responsible for the nominal GDP growth experienced from 1981 to 1985 (Gale & Samwick, 2014). This effect confirms that different tax policies can have varied effects, intended or otherwise. Econland’s tax policy in relation to trade interactions yielded favorable results that were expected to a certain extent.
Fiscal Policy: Government Expenditure
Figure 3.1: GDP vs Unemployment Rates
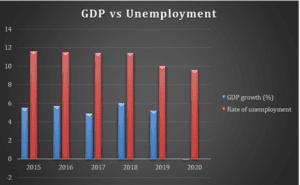
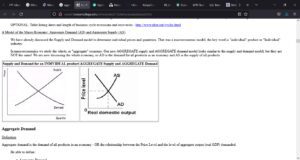
Figure 3.2: AS/AD
Econland’s government expenditure increased between 2015 and 2020. The expansionary policies sought to develop infrastructures such as roads and public facilities, including hospitals and schools. The improvement of existing major roads was intended to open the rural areas and stimulate other local economies through various economic activities. The building of hospitals and schools was intended to ensure that citizens can easily access healthcare and education, aspects that have been identified as important for the country’s overall development. The results that were obtained from these expansionary policies were positive and trickled into the general economy (Onifade, Cevik, & Erdogan, 2020).
The increased expenditure led to the creation of new job opportunities through the multiplier effect. The roads, hospitals, and schools employed individuals both directly and indirectly. The multiplier effect led to a gradual reduction of unemployment in the country’s population. As more individuals secured employment, the government could generate additional revenue through taxation. In addition, the economy experienced gradual growth over this period. However, in 2020, the GDP turned out negative because of the Covid-19 pandemic, which began in 2019. The GDP’s growth plummeted in 2019 as more businesses were phased out.
The government’s increased expenditure had an impact on the aggregate demand. As more individuals gained employment, their spending ability increased. At the same time, the businesses could meet the new demand for products and services. Thus, the aggregate demand increased, causing supply to rise as well (Saymeh & Orabi, 2013). The new infrastructure also injected additional demand for certain services and products.
Monetary Policies
Figure 4.1: Inflation rate
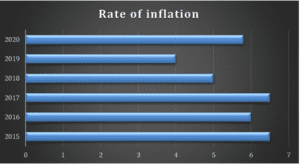
According to the graph above, the rate of inflation was erratic as it experienced increments and decrements. The inflation rate is closely connected to interest rates, which are volatile. The high rates of inflation affected the interest rates by increasing them. When the interest rates increase, the real GDP also grows. The respective federal agencies were responsible for ensuring that the inflation rate did not rise too much to affect the GDP negatively. The countermeasure in such a case is increasing the rates of interest, which slows down the inflation rates. When prices increase, consumption reduces because the citizens seek cheaper alternatives. This illustrates the reduction in value for money. Citing the American financial depression, the overproduction led to excessive supply in the market. Due to selling items at a loss, the companies had to reduce production, which led to increased unemployment. By 1933, the rate of unemployment was 24.9 percent. These aspects affected the GDP negatively. Low interest rates that were maintained by the Federal Reserve resulted in a loss of value for money (deflation) and a lack of sufficient supply of money. This situation conforms to the role of different agencies and the importance of monitoring the interest rates to ensure the maintenance of decent inflation rates that are neither too high nor too low (Field, 2020).
Global Context
An open economy is one that supports trade between nations, while a closed one has restrictive trade policies. Maintaining an open economy attracts various ills and benefits. In the case of Econland, the open economy allowed the country to trade with others leading to exports and imports. However, there are more imports than exports. This signals low industrial production within Econland. Open economies can kill local industries as companies are unable to compete with goods obtained from other countries, with cheaper production (Mankiw, 2021). Thus, such controls are necessary to protect the local producers from unfair competition from foreigners. Installation of certain tariffs should objectively achieve specific goals. For instance, the USA installed a 20 percent tariff on imports through the Tariff Act of 1930 (Field, 2020). This led to a reduction in imports. The bill was intended to protect local producers but pushed away foreign nations that sought to trade with the country. The result affected the citizens and the economy negatively because local producers maintained minimum production as citizens’ buying power was reduced, leading to low demand. Thus, the economy’s openness or closeness should be monitored to avoid such negative effects.
Conclusion
Econland’s macroeconomic factors were dependent on the fiscal and monetary policies that were installed during my tenure. I like to believe that the decisions made were appropriate in maintaining a thriving economy. The economic policy decisions achieved the intended goals in Econland. The government obtained more taxes due to increased expenditure, which created significant employment and improved the people’s financial empowerment. However, it is necessary to ensure that the local producers gain a footing by increasing the conditions that favor their production. This should increase the country’s exports, which brings in more revenue and foreign exchange. Thus, the country may need to regulate the economy’s openness to protect local producers from unfair competition that is associated with foreign goods. Consumer confidence reflects the level of optimism among citizens in relation to the country’s economy. The citizens of Econland demonstrated positivity through their confidence indices. This positivity confirmed that the government had made the right economic policy decisions, and the results were visible to the citizens. For instance, the decision to direct government revenue towards the development of infrastructure was met with great optimism as citizens expected new jobs and business opportunities to mushroom in the areas. Furthermore, direct employment sustained the local economies and lifestyles of citizens for a significant period. The expenditure also improved the efficiency of business owners and made access to goods and services easy.
References
Field, A. (2020). The main causes of the Great Depression and how the road to recovery transformed the US economy. Business Insider Africa.
Gale, W. G., & Samwick, A. A. (2014). Effects of Income Tax Changes on Economic Growth. Brookings Institution. Retrieved from https://www.brookings.edu/wp-content/uploads/2016/06/09_effects_income_tax_changes_economic_growth_gale_samwick.pdf
Onifade, S. T., Cevik, S., & Erdogan, S. (2020). An empirical retrospect of the impacts of government expenditures on economic growth: New evidence from the Nigerian economy. Journal of Economic Structures, 9(6).
Mankiw, N. G. (2021). Principles of economics (9th ed.). Cengage Learning.
Saymeh, A. A., & Orabi, M. M. (2013). The Effect Of Interest Rate, Inflation Rate, GDP, On Real Economic Growth Rate In Jordan. Asian Economic and Financial Review, 3(3), 341-354.
ORDER A PLAGIARISM-FREE PAPER HERE
We’ll write everything from scratch
Question 
Economic Summary Report
Competencies
In this project, you will demonstrate your mastery of the following competencies:
- Make decisions informed by macroeconomic principles and the business cycle
- Determine the economic impact of historical and current events using models of macroeconomics
- Assess how changes to macroeconomic policies impact the economy
Scenario
You have just completed your seven-year term as the chief economic policy advisor responsible for managing the economy of the nation of Econland. You are expected to create a report for the incoming administration. In this outgoing report, you will summarize your macroeconomic policy decisions and the economic outcomes for Econland. The purpose of this report is to share the lessons you’ve learned over your term and promote sound macroeconomic decision-making moving forward.
Directions
First, assemble the materials that you will need to complete this assignment:
- Access the Macroeconomics Simulation: Econland from Harvard Business Review and select either the Rollercoaster or Stagnation scenarios. Once you have completed the final year of your seven-year term, you can access the final reports under the Dashboard and Reports tabs at the top of the webpage. You will use these charts, graphs, and other visualizations to illustrate your report in the indicated areas of the template (for example, Table 1.1). Reach out to your instructor if you have any questions about accessing these resources.
- Review and use the Project Template located in the What to Submit section.
- The cover page, Table of Contents, and Introduction sections of your report are provided and should remain standard in all submissions except where indicated in the template. You should read the brief Introduction section, as it provides insight into the purpose and structure of the deliverable, and add the high-level descriptions where prompted.
-
- There are placeholders in the template for your data visualizations (e.g., charts, graphs, tables, etc.). These placeholders are meant to give you a rough approximation of the required placement of the visualizations. You should replace the placeholders with the appropriate, indicated images in each case. To create an isolated image from the simulation data, you should use a snipping tool or other image-editing software to copy and paste your data visualizations into the template. See the relevant tutorials in the Supporting Materials section for more information.
-
- You are expected to reference any source material used in your report with appropriate citations. To support you, a References page has been added to the project template with the citation for the course’s reading already provided. Any other references you add should be cited according to APA format.
Once you have assembled the required materials listed above, you can now begin drafting your economic summary report by completing the following steps:
- The first section of your report is the Introduction, in which you will personalize the provided content with the particular information related to your term (i.e., your simulation results) as the chief economic policy advisor for the nation of Econland. Follow the instructions in the template for contextualizing this section, including adding Table 3 from your simulation report to the indicated area of the template (i.e., Table 1.1). Then, add a two- to three-sentence summary specifying which underlying scenario you chose and your overall performance and approval rating.
- Taxation Policies: In the Fiscal Policies: Taxation section of your report, discuss the taxation policies of Econland for the public and your successor. Within this section, you should add an image of Table 1 from your simulation results to the indicated area of the template (i.e., Table 2.1). Then, answer the following questions in the paragraphs below the table:
- Explain your intent regarding the taxation policy decisions you made over your seven-year term. What were the macroeconomic principles or models that influenced your decision-making?
- Identify the impact of your changes on income and corporate tax rates. How were consumption and investment affected by your tax policy decisions? Explain these dynamics using specific macroeconomic principles from the course reading.
- Compare and contrast the impact of your tax policy decisions with those of current or historical examples in the United States. What do these examples demonstrate about the validity of macroeconomic models? Be sure to cite your research appropriately. (See the Supporting Materials section.)
- Government Spending: In the Fiscal Policies: Government Expenditure section of your report, discuss Econland’s government spending policies for the public and your successor. Within this section, you should add an image of the “Real GDP Growth” and “Unemployment Rate” graphs from your simulation results and use an aggregate demand and aggregate supply (AD/AS) model to the indicated area of the template (i.e., Figures 3.1 and 3.2). Images of the AD/AS model can be found in the course reading or any reputable online source. Then, answer the following questions in the paragraphs below the figures:
- Explain your decision-making regarding government expenditure and how it changed based on the macroeconomic conditions. What was the intent of your fiscal policy decisions in response to the given economic climate?
- Evaluate your fiscal policy decisions, including how they impacted key macroeconomic factors such as real GDP growth and unemployment. To what extent did your policies yield positive or negative outcomes?
- Refer to the AD/AS model to support your analysis in this section of your report.
- Monetary Policies: In the Monetary Policies section of your report, discuss the monetary policies of Econland for the public and your successor. Within this section, you should add an image of the “Inflation Rate” graph from your simulation results to the indicated area of the template (i.e., Figure 4.1). Then, answer the following questions in the paragraphs below the figure:
- Explain how you changed the interest rate levels and how these changes impacted other macroeconomic factors such as inflation, consumption, investments, GDP, and foreign trade. Provide specific examples to help illustrate.
- Compare and contrast the impact of your monetary policies with those of current or historical examples in the United States. What do these examples demonstrate about the validity of macroeconomic models? Be sure to cite your research appropriately. (See the Supporting Materials section.)
- Global Context: In the Global Context section of your report, you will expand your discussion from the particular case of Econland to consider the wider global context. Analyze the impacts of openness to trade in general. Why and how are the impacts of monetary and fiscal policies different in a closed economy versus an open economy? Support your claims with specific details from the course reading.
- Conclusions: In the Conclusions section of your report, draw your overall conclusions about the relevance and significance of macroeconomics for the public and your successor.
- Assess the effectiveness of your economic policy decisions. Did your economic policy decisions produce the anticipated results? Did your macroeconomic principles and models behave in ways that you expected? Provide specific examples to illustrate.
- Evaluate how consumer confidence might have impacted the outcomes of your policy decisions for the economy of Econland. Why is consumer confidence a relevant factor for making informed macroeconomic decisions?
Finally, ensure that all of your sources are properly cited using in-line citations and references according to APA format.