ECO 202 Project
Economic Summary Report
Introduction
For the benefit of the incoming administration, I submit this report to document, analyze, and interpret the macroeconomic policy decisions I made as the chief economic policy advisor of Econland. This document aims to further our national prosperity by deepening our understanding of the relationship between macroeconomic policies and their consequences for our citizens. The report includes a thorough account of the major fiscal and monetary policy decisions made over each of the seven years of my term, as well as an explanation of the underlying rationales for those decisions and the resulting impacts of those policies: ECO 202 Project.
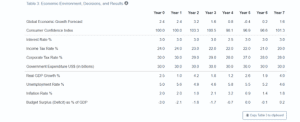
Table 1
The table above summarizes the macroeconomic climate of Econland over my term. The selected case is the Rollercoaster scenario, which is characterized by instability and fast economic development. I managed to stabilize the economy and achieve an average approval rating of 81. The economy maintained a favorable growth rate, whereby a budget surplus was attained with a reduced government expenditure.
Fiscal Policy: Taxation
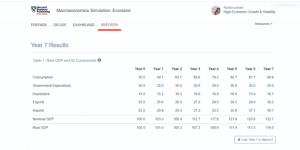
Table 2
There was a fair balance for the economy from the beginning, with an inflation rate of 2%. Further, a 5% unemployment rate was attained. Notably, the economy had an opportunity to enhance taxes on individuals and corporations by a small fraction from the beginning.
The main reason for this was to manage inflation and unemployment since an increase in taxes could help to keep the two low, as indicated in Table 2 above. Consumption grew gradually across the seven years. Since there was control over government expenditure, it was maintained constant across the seven years. The two had an influence on the level of unemployment for the period under consideration.
The impact on investment attained was not anticipated. Corporate taxes drastically cut down the amount of money available for reinvestment. Notably, unemployment would suffer greatly as a result. Every year, choices had to be made about preserving a sustainable level of investment and consumption on both an individual and business level since the two macroeconomic principles we considered crucial.
As the level of consumption grew each year for seven years, it was necessary to reduce the level of investment to balance the economic needs. It is interesting that we still managed to enhance the level of investment in some years, like year four, despite the increasing levels of consumption.
Depending on how they are implemented and the state of the economy, taxation policies may either promote or hinder economic growth. Additionally, a tax pay cut may encourage workers to put in longer hours, and when lower rates are implemented, even more savings would be realized. However, a tax cut might lead to unexpected rises in taxable income, which would force people to cut back on their work hours (Gechert & Heimberger, 2022).
In contrast to the substitution effect, which implies a scenario where lower marginal tax rates produce enhanced financial advantages from employment, the income effect, as it is often known, encourages individuals to work more for better incomes. Essentially, this is an example demonstrating how changes in consumption and government expenditure directly influence economic variables such as taxation and employment levels.
Fiscal Policies: Government Expenditure
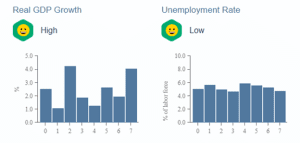
Figure 1
Note. From “2008 Global Financial Recession Impact on Yemen’s Economy and Oil Industry,” by A. Gaghman, 2021, Technium Social Sciences Journal. 5, p. 48 (https://doi.org/10.47577/tssj.v5i1.157).
Figure 2
Throughout the seven years, government expenditure was closely tracked to prevent maintaining a sizable surplus or deficit. The previous effects of adjustments on GDP led to both a rise and a drop in spending. Considering that this can slow economic development, overall spending had a decreasing net effect, which brought the budget deficit under control.
The approved fiscal policy strategy aimed to enhance economic development by increasing government expenditure, which may not have been feasible without a large reduction in the budget deficit. The government was capable of lowering interest rates progressively to stimulate economic development as the budget deficit was decreased on the way to achieving a budget surplus.
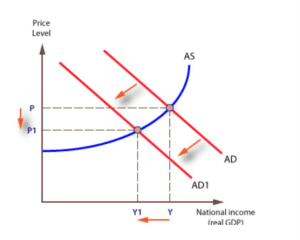
The fiscal policy improved the economic status of Econland by addressing government expenditure and taxation. Both policy implications sought to affect aggregate demand. According to Mankiw (2024), reduced corporation taxes promote investment spending, which in turn increases aggregate demand.
The same is true for lower taxes and government expenditure. The economy had average GDP growth as a result. In essence, this resulted in a lower unemployment rate in the economy. As a result, the fiscal policy that was implemented worked well and had favorable results.
Monetary Policies
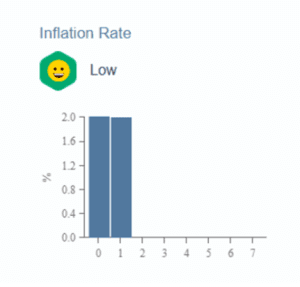
Figure 3
Throughout the seven years, interest rate levels were generally low. The interest rate was set at 2% in the first year and then lowered to 1%. Notably, this rose to 3.5% after increasing to 2% in the third year. After that, it fell to 1% before steadily increasing over the last two years.
In essence, this significantly affects the economy’s inflation levels. After declining in the first period, the inflation rate began to rise throughout the term. Interestingly, changes in savings and investment correlated with changes in interest rates. Interest rates were kept constant for most of the years because of a strong economy.
However, by the fourth year, the investments had started to fall. Interest rates were cut by taxes to gauge the impact, but more significant changes had to be implemented over the next two years due to the weak response in year four. Everything had steadied and yielded positive results by the end of the term.
A thriving economy was maintained while interest rates dropped to a steady trend, increasing people’s purchasing power. Consequently, the rate of inflation continued to increase over time. Cochrane (2024) asserts that interest rates and inflation rates are inversely related, which is consistent with the economic performance of Scotland.
The COVID-19 pandemic-induced economic downturn can be used as an example to illustrate the point. In the current economic climate, the Federal Reserve ensured that interest rates remained low until full labor force participation and a target inflation rate of 2% were achieved. It was predicted that the economy would continue to develop profitably by 2023, when the crisis may have finally been successfully contained internationally, even though this was a dangerous decision.
Inflation rates increased to previously unheard-of heights during this time. Notably, this example shows the Econland economy, where interest rates were low for most of the time. Like the U.S. throughout the epidemic, inflation rates continued to rise during this time.
Global Context
Since there is limited exposure to external impact, running a closed economy is simpler than running an open one. In an open economy, it would be difficult to function as global companies and trade would take over. Notably, when they take hold, other business-related elements also come into play, such as foreign exchange rates and politics surrounding multinational corporations. Since they are not subject to outside influences, policymakers are better able to focus on issues related to their local economy while it is closed.
This makes it simpler to deploy and execute fiscal and monetary policy. Both monetary and fiscal policy become more complex in an open economy. Thus, there is a direct impact on GDP consumption, which rises dramatically. Essentially, an open economy allows firms and consumers to access more goods and services, which leads to an economic boom.
Conclusions
From the beginning until the end, Econland’s economy remained strong. This does not, however, imply that there were no economic challenges. It shows that despite the difficulties, Econland was able to go forward owing to the economic decisions that were taken and put into action. The outcomes met the expectations that were maintained over the seven years.
From an optimistic perspective, the following seven years will begin on a positive note. It was intriguing to see how certain decisions and modifications had enormous repercussions while others had little or no immediate impact. In the third year, for example, Econland experienced a large deficit despite overall growth due to an increase in government spending. Notably, this was particularly intriguing because the second year had no effect, encouraging one to increase spending.
Consumer confidence was steady during the seven years. There were no issues with approvals, and the policy adjustments made during that time were warranted. Moreover, the modifications had important effects. Thus, it is noteworthy that consumer confidence should be carefully considered and play a significant influence in policy decisions.
Spending and consumption are likely to fall if people lack confidence in the economy. Put another way, there is a greater chance of increased investment, spending, and consumption when there is a high level of confidence. Decision-makers need to consider these considerations when deciding on fiscal and monetary policy.
References
Cochrane, J. H. (2024). Expectations and the neutrality of interest rates. Review of Economic Dynamics, 53, 194-223. https://doi.org/10.1016/j.red.2024.04.004
Gaghman, A. (2021). 2008 global financial recession impact on Yemen’s economy and oil industry. Technium Social Sciences Journal, 5, 46–60. https://doi.org/10.47577/tssj.v5i1.157
Gechert, S., & Heimberger, P. (2022). Do corporate tax cuts boost economic growth?. European Economic Review, 147, 104157. https://doi.org/10.1016/j.euroecorev.2022.104157
Mankiw, N. G. (2024). Principles of economics (10th ed.). Cengage Learning.
ORDER A PLAGIARISM-FREE PAPER HERE
We’ll write everything from scratch
Question 
ECO 202 Project Guidelines and Rubric
Competencies
In this project, you will demonstrate your mastery of the following competencies:
- Make decisions informed by macroeconomic principles and the business cycle
- Determine the economic impact of historical and current events using models of macroeconomics
- Assess how changes to macroeconomic policies impact the economy
Scenario
You have just completed your seven-year term as the chief economic policy advisor for Econland (the nation you have been helping to manage). Now, you are expected to write a report for the new administration. In this report, you will summarize your macroeconomic policy decisions and explain the economic outcomes for Econland. The purpose of this report is to share the lessons you’ve learned over your term and promote sound macroeconomic decision making moving forward.
First, assemble the materials that you will need to complete this assignment:
- Access the Macroeconomics Simulation: Econland from Harvard Business Publishing and select either the Rollercoaster or Stagnation scenario. Once you have completed the final year of your seven-year term, view the final reports under the Dashboard and Reports tabs at the top of the webpage. You will use these charts, graphs, and other visualizations from your report in the indicated areas of the template (for example, Table 1). Contact your instructor if you have any questions about accessing these resources.
- Review and use the Project Template document located in the What to Submit section.
- Your report’s cover page, Table of Contents, and “Introduction” section should remain standard in all submissions except where indicated in the template. Read the brief “Introduction” section, which describes the purpose and structure of the deliverable, and add the high-level descriptions where prompted.
- There are placeholders in the template for your data visualizations (for example, charts, graphs, and tables). They provide a rough approximation of where the visualizations should be placed. Replace these placeholders with the appropriate images in each case. To create an isolated image from the simulation data, use a snipping tool or other image-editing software to copy and paste your data visualizations into the template. See the tutorials in the Supporting Materials section for more information.
- Reference any source material in your report with appropriate citations. A references page has been added to the project template with the citation for the textbook. Any additional references should also be cited according to APA format.

ECO 202 Project
Directions
Once you have assembled the required materials listed above, draft your economic summary report by completing the following steps:
- The first section of your report is the introduction. Add information related to your term as the chief economic policy advisor for the nation of Econland. Follow the instructions in the template, including adding Table 3 from your simulation report to the indicated area of the template (Table 1). Then, add a two- to three-sentence summary of your scenario and your overall performance and approval rating.
- Taxation Policies: In the “Fiscal Policies: Taxation” section of your report, discuss the taxation policies of Econland for the public and your successor. Add an image of Table 1 from your simulation report to the indicated area of the template (Table 2). Then, address the following in the paragraphs below the table:
- Explain your intent for your taxation policy decisions over your seven-year term. What were the macroeconomic principles or models that influenced your decision making?
- Identify the impact of your changes to the income and corporate tax rates. How were consumption and investment affected by your tax-policy decisions? Explain these dynamics using specific macroeconomic principles from the course reading.
- Compare and contrast the impact of your tax policy decisions with those of current or historical examples in the United States. What do these examples demonstrate about the validity of macroeconomic models? Be sure to cite your research appropriately. (See the Supporting Materials section for assistance with APA style.)
- Government Spending: In your report’s “Fiscal Policies: Government Expenditure” section, discuss Econland’s government spending policies for the public and your successor. Add an image of the “Real GDP Growth” and “Unemployment Rate” graphs from your simulation results and use an aggregate demand and aggregate supply (AD/AS) model to the indicated area of the template (Figures 1 and 2). Images of the AD/AS model can be found in the course textbook or any reputable online source. Then, address the following in the paragraphs below the figures:
- Explain your decision making regarding government expenditure and how it changed based on the macroeconomic conditions. What was the intent of your fiscal policy decisions in response to the given economic climate?
- Evaluate your fiscal policy decisions, including how they impacted key macroeconomic factors such as real GDP growth and unemployment. To what extent did your policies yield positive or negative outcomes?
- Refer to the AD/AS model to support your analysis in this section of your report.
- Monetary Policies: In the “Monetary Policies” section of your report, discuss the monetary policies of Econland for the public and your successor. Add an image of the “Inflation Rate” graph from your simulation report to the indicated area of the template (Figure 3). Then, address the following in the paragraphs below the figure:
- Explain how you changed the interest rate levels and how these changes impacted other macroeconomic factors such as inflation, consumption, investments, GDP, and foreign trade. Provide specific examples to help illustrate.
- Compare and contrast the impact of your monetary policies with those of current or historical examples in the United States. What do these examples demonstrate about the validity of macroeconomic models? Be sure to cite your research appropriately. (See the Supporting Materials section for assistance with APA style.)
- Global Context: In the “Global Context: section of your report, expand your discussion to consider the wider global context. Analyze the impacts of openness to trade in general. Why and how are the impacts of monetary and fiscal policies different in a closed economy versus an open economy? Support your claims with specific details from the course reading.
- Conclusions: In the “Conclusions” section of your report, draw your overall conclusions about the relevance and significance of macroeconomics for the public and your successor.
- Assess the effectiveness of your economic policy decisions. Did your economic policy decisions produce the anticipated results? Did your macroeconomic principles and models behave how you expected? Provide specific examples to illustrate.
- Evaluate how consumer confidence might have impacted the outcomes of your policy decisions for the economy of Econland. Why is consumer confidence a relevant factor for making informed macroeconomic decisions?
- Cite your sources according to APA format.
What to Submit
To complete this project, you must submit the following:
Economic Summary Report: Project Template
Use this template to create and submit your economic summary report for grading. It should outline the key principles and takeaways of your Econland simulation for your successor. Sources should be cited according to APA style.
Supporting Materials
Resource: Board of Governors of the Federal Reserve System
Use this resource to support your research for the U.S. Comparisons portions of the “Fiscal Policy: Taxation” and “Monetary Policies” sections of your report.
Resource: Budget and Economic Data
Use this Congressional Budget Office resource to support your research for the U.S. Comparisons portions of the “Fiscal Policy: Taxation” and “Monetary Policies” sections of your report.