Discussion: Evaluate Sampling, Randomization, and Design Concepts
G*Power Sample‑Size Calculation
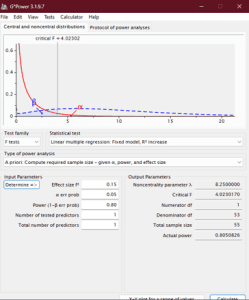
A priori power analysis was performed in G*Power 3.1.9.7 (Test family = F tests; Statistical test = linear multiple regression, R² increase). With f² = 0.15 (medium effect), α = .05, power = .80, one tested predictor (academic procrastination), and no covariates, the program returned N = 55. This is the minimum number of graduate students needed to detect the unique predictive effect of procrastination on either stress or GPA.
Population, Sampling, and Design Decision
Population and Accessible Sample
The target population comprises all graduate students enrolled in accredited master’s and doctoral programs. Practical constraints restrict access to those registered at University X during the 2025–26 academic year (≈1,200 students). This frame provides institutional e‑mail addresses for survey distribution and GPA retrieval, ensuring administrative support and ethical oversight.
Sampling Strategy and Issues
True random sampling is difficult because participation is voluntary, and no intervention is assigned. A stratified random sample will therefore be drawn, using colleges (for example, STEM, Social Sciences, Professional) as strata. Stratification guards against over‑representation of large programs and enhances external validity. Expected non‑response and incomplete data warrant an oversample of 15 % (invitations to ≈65 students) to secure the required 55 usable cases. Two threats remain: self‑selection bias—highly conscientious students may respond more often, restricting variance in procrastination scores—and range restriction in GPA if some programs employ pass/fail grading. Nonetheless, mitigation includes reminder e‑mails, modest incentives, and post‑hoc checks comparing early versus late responders on key measures.
Randomization Alternatives
Although random assignment is unattainable in this observational study, statistical controls (for instance, program type, study load) can be entered as covariates if warranted. If many controls are added, a follow-up power analysis will be run to update the sample size accordingly.
Design Choice
Among the three classic quasi‑experimental frames, a time‑series design is ideal. Surveying the same students at four points (Weeks 2, 6, 10, 14) transforms the static regression into a lagged‑panel analysis in which earlier procrastination predicts later stress and cumulative GPA while controlling for prior levels. Time‑series data improve causal inference by demonstrating precedence and accommodating intra‑individual variability, advantages not offered by a single pretest/posttest or factorial configuration (Creswell & Creswell, 2018). Multilevel modeling will analyze repeated measures, and the original G*Power estimate (N = 55) remains a conservative lower bound because repeated observations typically boost statistical power.
References
Creswell, J. W., & Creswell, J. D. (2018). Research design: Qualitative, quantitative, and mixed methods approach (5th ed.). SAGE.
ORDER A PLAGIARISM-FREE PAPER HERE
We’ll write everything from scratch
Question 
Discussion: Evaluate Sampling, Randomization, and Design Concepts
Week 3 – Assignment: Evaluate Sampling, Randomization, and Design Concepts
Begin by reviewing the G*Power manual and tutorial found in this week’s resources. This manual will explain how to run a G*Power analysis to calculate the minimum sample size needed for your study. Then, run a G*Power analysis and report the results by creating a Kaltura video (make sure you describe your results and how you conducted the G*Power analysis). Many issues affect power, all of which we will not go into in this course. For instance, non-parametric data does not fit a normal distribution, effect size calculation, prevalence rate of variable you are studying in your population, and attrition of subjects. To account for these issues, it is a good idea (and mandated for this assignment) to add 15% to a final sample size calculation.
Evaluate Sampling, Randomization, and Design Concepts
After reviewing this week’s resources, including the dissertation, be sure to explain your population and sample, sampling issues such as randomization and potential alternatives. Then, determine which design (pretest/posttest, time-series, or factorial design) you will use for your proposed study and why.
References: An Applied Guide to Research Designs: Quantitative, Qualitative, and Mixed Methods by W. Alex Edmonds; Thomas D. Kennedy
ISBN: 9781483317274
Publication Date: 2016-05-30
Edmonds, W. A., & Kennedy, T. D. (2017). An applied guide to research designs: Quantitative, qualitative, and mixed methods (2nd ed.). SAGE.
This resource will explain randomization, pretest/posttest, time-series, or factorial design, population, and sample. Please read and focus on pp. 13-26, 29-92 this week.
* There is a “Show Page Numbers” function available when you access the book’s chapters. It is above the title of the chapter, off to the right. This is an example:
G*Power: Statistical Power Analyses for Windows and Mac
G*Power: Statistical Power Analyses for Windows and Mac. (n.d.). G*Power: Statistical power analyses for Windows and Mac. HHU.
Download G*Power software from this resource, which is a statistical tool for sample size justification.
Sampling Design and Survey Data
Lee, E. S., & Forthofer, R. N. (2011). Sample design and survey data. SAGE.
G*Power