Digital Transformation of Cost Accounting and Home Prices in the US
Question 1
After reviewing the videos and text on research strategies, I have decided to change my topic slightly from technology integration in cost accounting to digital transformation of cost accounting. The decision to change the topic was due to the broad nature of the initial topic. Technology integration in cost accounting is broad, and it includes other components I never intended to cover. However, digital transformation is more specific as a research topic.
Some terms I used to research the topic include digital transformation, cost accounting tools, accounting management, the Internet of Things (IoT), blockchain, big data, and cloud computing. These terms were useful since they helped me narrow the topic and understand it better. Besides, all these terms reflect technology applications in financial accounting. I used the SMSU database for the research. The database contains millions of open-access academic articles that proved useful in the search process.
Keying the keywords above into the SMSU database resulted in multiple search results. For instance, the search ‘cost accounting ‘digital age’ produced 205 articles. A quick perusal of the initial pages shows that most articles are relevant to the topic under review, save for a few. On the other hand, the search ‘digital transformation in cost accounting’ on the SMSU database produced 93 article results, most of which refer to the application of digital technology in healthcare cost accounting. The database is valuable in narrowing down research to obtain relevant sources.
These articles will provide first-hand organizational evidence on digital transformations in cost accounting. They offer a real-world application of digital-based accounting processes in healthcare costing (Vărzaru, 2022). However, I may require help to filter out irrelevant articles from the search results.
Question 2
Home Prices in the US
Figure 1
Source: https://www.statista.com/chart/32922/median-home-sales-price-in-the-us-per-month/
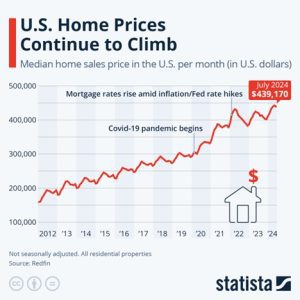
Figure 1 above shows how home prices in the US have been going up over the years. According to the data represented in the graphic, the prices have increased progressively over the years. However, the pandemic led to a sharp increase in prices due to high demand (Buchholz, 2024). Fast forward to 2022, mortgage rates rose significantly due to inflation and Fed rate hikes, leading to reduced disposable income. Prices dropped slightly since fewer people were willing to purchase homes at the then-current rates, but the pricing continues to skyrocket. Another significant trend is the impact of COVID-19 and the reduction of home prices (Schwartz & Wachter, 2023). This is because conditions necessitated people to stay at home, in addition to the need for a sense of permanency during the pandemic.
One of the guidelines of an effective graphic is that readers should be able to tell what it represents through a quick glance. The graphic above fulfills this guideline since the X and Y axes are well-positioned to represent pricing changes over time. One does not have to consult the primary document to comprehend the graph’s contents. Another guideline is that written text and visuals must work together so that the text offers insights into what the graphic illustrates. The graphic complies with this criterion since the title summarizes the content in Figure 1- home prices are still rising. Besides, the author’s narrative explains the factors contributing to a spike in home prices and the current state.
Thirdly, a graphic should not conceal information, misrepresent facts, or exaggerate trends. Figure 1 above fulfills this requirement because it does not misrepresent facts. For instance, the spike in Fed rates and inflation may have increased the cost of living, leaving people with less disposable income to purchase homes, but this did not significantly affect demand (Buchholz, 2024). The graphic aligns with the guideline since the author captures this trend but does not draw a blanket conclusion.
The fourth guideline is subdivided into different requirements. One of the requirements is that the Y and X axes should display standard measurement units. This requirement has not been attained since the standard units of measurement are not indicated on the axes. Secondly, important illustrations should be explained through explanatory text, and this has been achieved since, at some point, there is an indication of the point of onset of the COVID-19 pandemic and its impact on housing costs in the figure. Lastly, the source of the data used in a graphic should be identified underneath the graphic. Figure 1 fulfills this requirement since the author identified ‘Redfin’ as the data source.
References
Buchholz, K. (2024, August 27). Infographic: U.S. Home Prices Continue To Climb. Statista Daily Data; Statista. https://www.statista.com/chart/32922/median-home-sales-price-in-the-us-per-month/
Schwartz, A. E., & Wachter, S. (2023). Covid-19’s impacts on housing markets: Introduction. Journal of Housing Economics, 59, 101911. https://doi.org/10.1016/j.jhe.2022.101911
Vărzaru, A. A. (2022). Assessing digital transformation of cost accounting tools in Healthcare. International Journal of Environmental Research and Public Health, 19(23), 15572. https://doi.org/10.3390/ijerph192315572
ORDER A PLAGIARISM-FREE PAPER HERE
We’ll write everything from scratch
Question 
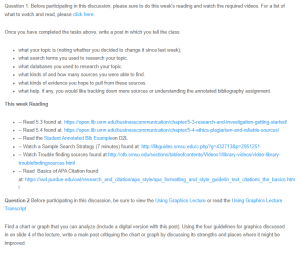
Question 1: Before participating in this discussion, please sure to do this week’s reading and watch the required videos. For a list of what to watch and read, please click here.
Digital Transformation of Cost Accounting and Home Prices in the US
Once you have completed the tasks above, write a post in which you tell the class:
- what your topic is (noting whether you decided to change it since last week);
- what search terms you used to research your topic.
- what databases you used to research your topic.
- what kinds of and how many sources you were able to find.
- what kinds of evidence you hope to pull from these sources.
- what help, if any, you would like tracking down more sources or understanding the annotated bibliography assignment.
This week Reading
- — Read 5.3 found at: https://open.lib.umn.edu/businesscommunication/chapter/5-3-research-and-investigation-getting-started/
- — Read 5.4 found at: https://open.lib.umn.edu/businesscommunication/chapter/5-4-ethics-plagiarism-and-reliable-sources/
- — Read the Student Annotated Bib Exampleon D2L
- — Watch a Sample Search Strategy (7 minutes) found at: http://libguides.smsu.edu/c.php?g=432713&p=2951251
- — Watch Trouble finding sources found at:http://otb.smsu.edu/sections/tableofcontents/Videos1/library-videos/video-library-troublefindingsources.html
- — Read Basics of APA Citation found at: https://owl.purdue.edu/owl/research_and_citation/apa_style/apa_formatting_and_style_guide/in_text_citations_the_basics.html
Question 2 Before participating in this discussion, be sure to view the Using Graphics Lecture or read the Using Graphics Lecture Transcript
Find a chart or graph that you can analyze (include a digital version with this post). Using the four guidelines for graphics discussed in on slide 4 of the lecture, write a main post critiquing the chart or graph by discussing its strengths and places where it might be improved.