Developing a Sales Strategy
As the new Vice President of sales in the organization, I am tasked to develop a clear and well-defined sales strategy for products in the organization to improve profitability. This can be achieved through predictive modelling and other analysis methods. Price and sales volume are the basic and most important statistics for a sales manager. The relationship between price and sales can be used to derive the market demand for a product. Also, the demand and supply can be used to predict market prices. The relationship between these variables enables an organization develop an economic understanding of the market. The relationships are explained under the law of supply and demand (Krammer, 2021). Technically, when demand exceeds supply, prices increase because buyers compete for the available quantity of goods. When the industry or organizational demand is equivalent to the available goods and services, a market equilibrium is created, and the prices of goods and services stabilize.
In the context of the organization, sales and price modeling for Product X provides a basis for predicting the sales volume with changes in prices. Figure 1 below shows a summary of sales and prices of Product X.
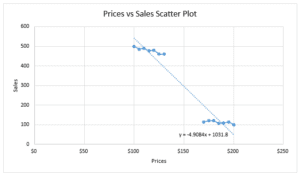
Figure 1: The Summary Scatter plot
The curve of sales and prices of a commodity usually has a negative gradient. This is evident from the equation above. The negative gradient implies an inverse relationship between prices and sales volume. Particularly, when the prices of Product X increase, the organization experiences a decrease in sales volume. Considering the base price of $100 to $130 and interested in knowing how the prices move between the range of $135 to $165, a predictive model can be used. The scatter plot shows the trend between the price and sales. However, the gap in the data points is due to the unknown sales between $135 and $165. The unknown sales can be predicted by using the linear equation y=-4.9084x +1031.8. In the equation, y is the sales, and x represents the prices. The relationship between sales and prices can be predicted by substituting the prices, x, to the equation to obtain y. The negative m (y= mx + c) indicates an inverse relationship between x and y. This implies that the increase in prices will lead to a decrease in sales.
For instance, predicting the sales when the price is at $160 and $140 becomes;
y=-4.9084x +1031.8
= -4.9084(140) +1031.8 = 345
y= -4.9084x +1031.8
= -4.9084(160) +1031.8 = 246.
Further, to understand the relationship between the sales and prices between $135 and $165, the two sales amounts can be compared. When the price is high, the sales value is low and vice versa.
In predicting the relationship between sales and prices below $100, the same model can be used. This can be achieved by taking any price below $100 and substituting it in the model to obtain the predicted sales. For instance, to predict the sales at $50;
y= -4.9084x +1031.8
= -4.9084(50) +1031.8 = 786.
The low price and high sales further confirm the inverse relationship between the sales and prices even below $100. Extrapolation can also be used to obtain the prices and volumes that lie beyond the trend line.
The analysis informs the sales strategy adopted in the organization from several perspectives. Ideally, the analysis confirms the inverse relationship between price and sales for a normal market good (Petryni, 2020). In formulating the sales strategy, the company can employ production methods that do not raise the total costs of production to ensure profitability even when goods are sold at low market prices. For instance, the raw materials for producing the product can be sourced locally. Discounting can also be applied to the product to increase sales and attract more customers. Strategies such as economies of scale can also be employed to attract more customers (Reisman, Payne, & Frow, 2019). Alternatively, improving the quality of Product X can also increase sales even when the prices are relatively higher compared to the current prices. Also, to increase sales without an increase in prices, the organization can promote Product X more aggressively, for instance, through cheaper methods such as social media to attract buyers.
Sales and Prices Data
| Sales | Price |
| 500 | $100 |
| 485 | $105 |
| 490 | $110 |
| 477 | $115 |
| 480 | $120 |
| 460 | $125 |
| 460 | $130 |
| $135 | |
| $140 | |
| $145 | |
| $150 | |
| $155 | |
| $160 | |
| $165 | |
| 115 | $170 |
| 120 | $175 |
| 121 | $180 |
| 107 | $185 |
| 108 | $190 |
| 115 | $195 |
| 100 | $200 |
References
Krammer, L. (2021). How Does the Law of Supply and Demand Affect Prices? Retrieved from https://www.investopedia.com/ask/answers/033115/how-does-law-supply-and-demand-affect-prices.asp
Petryni, M. (2020). Relationship Between Sales Volume and Mean Pricing. Retrieved from https://smallbusiness.chron.com/running-a-business/
Reisman, R., Payne, A., & Frow, P. (2019). Pricing in consumer digital markets: A dynamic framework. Australasian Marketing Journal (AMJ). Volume 27, Issue 3, Pages 139-148, ISSN 1441-3582, https://doi.org/10.1016/j.ausmj.2019.07.002.
ORDER A PLAGIARISM-FREE PAPER HERE
We’ll write everything from scratch
Question 
Developing a Sales Strategy
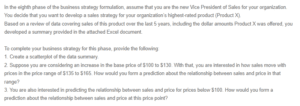
In the eighth phase of the business strategy formulation, assume that you are the new Vice President of Sales for your organization. You decide that you want to develop a sales strategy for your organization’s highest-rated product (Product X).
Based on a review of data covering sales of this product over the last 5 years, including the dollar amounts Product X was offered, you developed a summary provided in the attached Excel document.
To complete your business strategy for this phase, provide the following:
1. Create a scatterplot of the data summary.
2. Suppose you are considering an increase in the base price of $100 to $130. With that, you are interested in how sales move with prices in the price range of $135 to $165. How would you form a prediction about the relationship between sales and price in that range?
3. You are also interested in predicting the relationship between sales and price for prices below $100. How would you form a prediction about the relationship between sales and price at this price point?