Delta Air Investment Analysis
Select five financial ratios, then analyze the past three years of financial data for the investment (please obtain data from the financial statements or the equivalent).
Profitability ratios
Profitability ratios comprise financial metrics investors and analysts utilize to assess and examine a company’s ability to generate profit from revenue. This analysis will analyze the Return on Assets (ROA) and Return on Equity ratios over the past three-year period. ROA is a form of Return on Investment (ROI) that evaluates a business’s profitability in relation to the total assets (Monahan, 2018). This ratio computed the revenue generated from each dollar investment in its assets. This ratio is computed by dividing the net income by the average assets. 2018 Delta Air recorded 6.93, 7.64, and -18.09 in 2018, 2019, and 2020, respectively. In 2018, Delta Air produced 0.06 cents for every dollar invested in the company’s assets (Yahoo Finance , n.d). The low ROA features the airline sector and is attributed to the high capital outlay required in the sector. This ratio improved in 2019, implying improved financial performance. It recorded a drastic decline in 2020 due to the disruption of travel operations by the COVID-19 pandemic. Nonetheless, the company anticipates an increase in net income as it resumes operations and the opening up of the global economy. The return on equity evaluates a company’s effectiveness in generating wealth from shareholders’ investments. This ratio is computed by dividing the net income by the total stakeholders’ equity. The company registered 28.52, 32.82, and -146.24 ROE in 2018, 2019, and 2020 respectively. Notably, its ROE was considerably high in the two years preceding the pandemic. In 2019, Delta Air produced 33 cents profit for every dollar invested in the organization’s shareholders.
Liquidity Ratios
Liquidity ratios evaluate a company’s ability to service short-term debt obligations. This ratio illustrates the viability of the company’s operations (Monahan, 2018). This report analyzes the quick and current ratios in examining Delta Air’s effectiveness in servicing the current debt. The quick ratio evaluates a company’s capability to repay its current liabilities using only the quick assets. The latter refers to current assets that can be converted to cash within a 90-day period. This ratio is computed by dividing the total current assets, less inventory, and prepaid expenses, by the current liability. Delta Air’s quick ratio was 0.22, 0.28, and 0.97 in 2018, 2019, and 2020, respectively (Yahoo Finance , n.d). In 2018, the firm could only repay 22% of the current liabilities with the quick assets. This ratio increased to 28% in 2019, signifying an improvement in its financial performance. In 2020, Delta Air recorded the highest quick ratio (0.97), which did not improve the company’s performance. The increase resulted from the decline in operations; thus, the company incurred lower liabilities in financing its operations. The current ratio analyzes a company’s capability to service its short-term obligations that come due within twelve months. This ratio is computed by dividing the current assets by the current liabilities. Delta Air registered 0.34, 0.41, and 1.09 in 2018, 2019, and 2020 respectively (Yahoo Finance , n.d). In 2018, the company’s ratio was 0.34, implying Delta’s current assets were sufficient to service 34% of the debt. This ratio increased to 0.41 in 2019, implying an improvement in its financial performance. In 2020, the company’s current assets were sufficient to service the business operations’ liabilities.
Debt Management Ratio Analysis
The debt management ratio evaluates a company’s ability to service its long-term debt, specifically the principal and interest payments (Monahan, 2018). This report analyzes the long-term debt to equity and total debt-to-equity ratios. The long-term debt-to-equity ratio determines a company’s leverage. It is computed by dividing the long-term debt with the aggregate common and preferred stock. This ratio’s formulae is computed by dividing the common and preferred stock’s summation with the equity ratio Delta Air recorded 0.6, 0.58, and 17.88 in 2018, 2019, and 2020 (Yahoo Finance , n.d) In 2018, 60% of the company’s financing was undertaken through debt. This ratio decreased to 0.58 in 2019. The long-term debt to equity escalated in 2020 and is attributed to the disruption of operations that led to the accumulation of debt since the company was not in a position to service the long-term liabilities. The total debt to equity is a liability ratio that determines the company’s percentage financed with debt and equity. The firm registered Total debt-equity ratios of 0.71, 0.73, and 19.01 in 2018, 2019, and 220, respectively. This ratio implies the company utilizes more debt financing as opposed to equity. Delta’s high leverage predisposes it to systemic risk, making its share riskier.
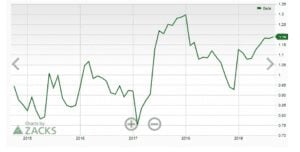
The graph below illustrates the company’s beta over the past five years. The beta is inconsistent since the lowest was recorded in 2017 and the highest in 2018 before declining in 2019. Notably, beta performance realigns with its financial performance over the past half-decade.

5 yrs graph
Analyze the investment price to stock market beta for the past five years.
1 Correlation coefficient AL, S&P 500
= Covariance AL, S&P 500 ÷ (Standard deviational × Standard deviations 500)
= 13.07 ÷ (7.59% × 3.45%)
= 0.50
2 βDAL
= Covariance AL, S&P 500 ÷ Variance S&P 500
= 13.07 ÷ 11.88
= 1.10
3 αDAL
= AverageDAL – βDAL × Average S&P 500
= 0.81% – 1.10 × 0.88%
= -0.15%
Determine the type of investor who would be the best candidate for the chosen investment (e.g., a risk-averse investor, an aggressive investor, a broker, and a dealer in the market). Provide a rationale for why this investment is a solid choice. Support your assertion that someone with the investor profile you outlined should invest in this stock.
Delta Air’s stock is risky due to its susceptibility to changes in the external environment. While other industries, specifically technology enterprises such as Amazon, registered record-high share price increases, Delta Air was adversely affected by the pandemic (Varma, 2020). The epidemic resulted in the implementation of lockdowns and international travel restrictions that adversely affected the airline sector. Thus, Delta Air operates in an adversely affected sector by macro-environmental events. It is important to note that flights would also be disrupted in case of political instability or war in a region. Secondly, Delta Air is highly leveraged, seeing that it utilizes more debt than equity. Debt is advantageous because it facilitates tax cost savings. At the same time, it increases the systemic risk. High leverage results in increased interest payments that lower the company’s profitability, thus predisposing it to financial distress. Secondly, the share is risky because the industry characterizes low profit margins. Risk-takers investors should purchase Delta’s stock in the present moment because it depreciated due to the decline in earnings (Lizarazo, 2013). The company’s share price is expected to appreciate in the coming years as the firm recovers from the pandemic’s losses.
References
DAYI, F., & ULUSOY, T. (2018). Evaluating Financial Performance With Minimum Spanning Tree Approach: An Application In Airlines Companies. Electronic Turkish Studies, 13(30).
Lizarazo, S. V. (2013). Default Risk And Risk Averse International Investors. Journal of International Economics, 89(2), 317-330.
Luo, D. (2014). The Price Effects Of The Delta/Northwest Airline Merger. Review of Industrial Organization, 44(1), 27-48.
Monahan, S. J. (2018). Financial Statement Analysis And Earnings Forecasting. Foundations and Trends® in Accounting, 12(2), 105-215.
Varma, T. M. (2020). Responsible Leadership and Reputation Management during a Crisis: The Cases of Delta and United Airlines. Journal of Business Ethics, 1-17.
Yahoo Finance (n.d). Delta Air Lines, Inc. (DAL) https://finance.yahoo.com/quote/DAL/chart
Appendix
| Profitability Ratio | 12/31/2020 | 12/31/2019 | 12/31/2018 | 12/31/2017 | 12/31/2016 | ||||
| ROA % (Net) | -18.09 | 7.64 | 6.93 | 6.84 | 8.35 | ||||
| ROE % (Net) | -146.24 | 32.82 | 28.52 | 27.31 | 37.7 |
| Liquidity Ratios | 12/31/2020 | 12/31/2019 | 12/31/2018 | 12/31/2017 | 12/31/2016 | ||||
| Quick Ratio | 0.97 | 0.28 | 0.22 | 0.27 | 0.35 | ||||
| Current Ratio | 1.09 | 0.41 | 0.34 | 0.42 | 0.49 |
| 12/31/2020 | 12/31/2019 | 12/31/2018 | 12/31/2017 | 12/31/2016 | ||||||
| 17.88 | 0.58 | 0.6 | 0.47 | 0.5 | ||||||
| 19.01 | 0.73 | 0.71 | 0.64 | 0.6 | ||||||
| Current | 12/31/2020 | 9/30/2020 | 6/30/2020 | 3/31/2020 | 12/31/2019 | |||||
| 31.65B | 25.64B | 19.50B | 17.89B | 18.20B | 37.59B | |||||
| 53.10B | 45.56B | 34.58B | 34.90B | 32.57B | 52.09B | |||||
| 4.86 | N/A | N/A | 5.22 | 3.91 | 8.26 | |||||
| 93.46 | 158.73 | 23.53 | N/A | 5.89 | 7.83 | |||||
| 23.16 | 39.13 | 6.78 | N/A | 589.22 | 0.73 | |||||
ORDER A PLAGIARISM-FREE PAPER HERE
We’ll write everything from scratch
Question
Investment Analysis
Now that you have done the research and made a selection on the stock of a publicly traded U.S. corporation in your first assignment, in Week 4, it’s time to take a closer look at your choice with a detailed analysis. To complete this assignment, refer to the scenario from your first assignment, Investment Selection.

Delta Air Investment Analysis
Note: Please include any financial statements or relevant financial information in an appendix after the “Sources” page in your paper. These links or additional documents are not included in the required page length.
Write a 4–6 page paper in which you do the following:
- Provide a detailed overview of the stock of the publicly traded U.S. corporation you selected in the assignment of Week 4. Provide the rationale for your selection and plans for a diversified portfolio.
- Select five financial ratios, then analyze the past three years of financial data for the investment (please obtain data from the financial statements or the equivalent).
- Analyze the price of the investment to stock market beta for the past five years.
- Create a trend line that depicts the price movement for the investment against the market index movement using elements of Microsoft Office, such as Excel, Visio, MS Project, or one of their equivalents (such as Open Project, Dia, and OpenOffice), as appropriate. Note: The graphically depicted solution is not included in the required page length.
- Determine the type of investor who would be the best candidate for the chosen investment (e.g., a risk-averse investor, an aggressive investor, a broker, and a dealer in the market). Provide a rationale for why this investment is a solid choice. Support your assertion that someone with the investor profile you outlined should invest in this stock.
- Use at least five quality academic resources in this assignment. Note: Wikipedia and similar websites do not qualify as academic resources. Visit the Strayer University Library.
This course requires the use of Strayer Writing Standards. For assistance and information, please refer to the Strayer Writing Standards link in the left-hand menu of your course.
The specific course learning outcome associated with this assignment is:
Propose why an investment is solid and who should invest in it.

