Data Exercise
According to the Bureau of Labor Statistics, the analysis below is based on the Employment Situation Summary from January 2022. In January 2022, the unemployment rate was 4.0%, an increase from the previous month, December 2021, whose rate was 3.9% (U.S. Bureau of Labor Statistics, 2022b). A 0.1% increase may not look like a significant change; it equals a 194,000 increase in the number of unemployed people, bringing the total number of unemployed to 6.5 million across the country.
The following is a breakdown of unemployment rates for January 2022 for various demographics. Adult men were 3.8%, Whites 3.4%, adult women 3.6%, Blacks 6.9%, teenagers 10.9%, Hispanics 4.9%, and Asians 3.6%. The difference between the previous month’s and January’s rates remained in line with the 0.1% increase in the countrywide average (U.S. Bureau of Labor Statistics, 2022b). Nonetheless, some groups had a larger change.
Although the Bureau of Labor Statistics has performed an excellent job of providing the best results, several constraints may complicate determining the unemployment rate. For instance, some jobless people are willing to work but are discouraged. The above group is classified as out of the labor force. In addition, a group who lie to the Census Bureau that they are willing to work and are searching for jobs while they are not. The group is classified as unemployed but might fit better into the out-of-the-labor-force category.
Unemployment affects the quality of living standards of families. The affected people live with the stress of the inability to pay for their expenses, such as monthly bills or groceries. In addition, unemployment poses a threat to the growth of an economy. The most significant contributor to a country’s GDP is personal consumption. Thus, if people cannot buy goods and services due to unemployment, the economy will suffer. Other than economic effects, unemployment is emotionally and psychologically damaging. There always seems to be increased rates of crime in poverty-stricken areas. This is because the people subjected to the conditions feel hopeless, and they steal and commit other malicious deeds in an effort for them and their families to survive.
Unemployment affects all people, from manufacturers to consumers. Manufacturers depend on consumers to purchase their products to generate their income. Thus, if the consumers cannot afford the products due to unemployment, all the groups suffer, and the economy is strained. The data above is critical in evaluating the current state and trajectory of the country’s employment rates. The information may benefit the citizens in observing cyclical and other economic trends. Besides, the Report gives statistics and information on wages and employment trends.
Part 2
The following evaluation is based on the Consumer Price Index (CPI) Summary from January 2022. For January 2022, the Consumer Price Index for All Urban Consumers (CPI-U) was 281.148. The percentage change in the CPI-U for January 2022 was 0.6% from the previous month (U.S. Bureau of Labor Statistics, 2022a). In the past 12 months, there was a 7.5% increase in all items index before seasonal adjustments. The two goods and services with an extensive price index were fuel, with a 9.5% increase, and electricity, with a 4.2% increase. On the other hand, the two goods with the lowest price increase were new vehicles at 0.0% and shelter at 0.3% (U.S. Bureau of Labor Statistics, 2022a). The goods and services with the highest price decrease were utility (piped) gas services at –0.5% and energy commodities at -0.6%.
People with a decrease in buying power due to a rise in the price index of the goods or services the particular consumer needs lose the most from inflation. In addition, businesses, too, may lose due to inflation. When certain services and goods rise, consumers may seek alternatives to avoid the price changes. Only consumers who are loyal to a brand will keep purchasing that brand even after the price increase. The data above helps measure the price and the trend of consumer goods. The CPI is a tool for measuring how the general economy is doing regarding inflation and deflation. The data influences people’s decisions when saving or spending money.
Part 3
Table 1
| Year or Month | All Civilian Workers | Men 20 years and over | Women 20 years and over | Both sexes 16-19 |
| 2000. | 4.0 | 3.3 | 3.6 | 13.1 |
| 2001. | 4.7 | 4.2 | 4.1 | 14.7 |
| 2002. | 5.8 | 5.3 | 5.1 | 16.5 |
| 2003. | 6.0 | 5.6 | 5.1 | 17.5 |
| 2004. | 5.5 | 5.0 | 4.9 | 17.0 |
| 2005. | 5.1 | 4.4 | 4.6 | 16.6 |
| 2006. | 4.6 | 4.0 | 4.1 | 15.4 |
| 2007. | 4.6 | 4.1 | 4.0 | 15.7 |
| 2008. | 5.8 | 5.4 | 4.9 | 18.7 |
| 2009. | 9.3 | 9.6 | 7.5 | 24.3 |
| 2010. | 9.6 | 9.8 | 8.0 | 25.9 |
| 2011. | 8.9 | 8.7 | 7.9 | 24.4 |
| 2012. | 8.1 | 7.5 | 7.3 | 24.0 |
| 2013. | 7.4 | 7.0 | 6.5 | 22.9 |
| 2014. | 6.2 | 5.7 | 5.6 | 19.6 |
| 2015. | 5.3 | 4.9 | 4.8 | 16.9 |
| 2016. | 4.9 | 4.5 | 4.4 | 15.7 |
| 2017. | 4.4 | 4.0 | 4.0 | 14.0 |
| 2018. | 3.9 | 3.6 | 3.5 | 12.9 |
| 2019. | 3.7 | 3.4 | 3.3 | 12.7 |
| 2019: Jan. | 4.0 | 3.7 | 3.6 | 12.9 |
| Feb. | 3.8 | 3.5 | 3.4 | 13.3 |
| Mar. | 3.8 | 3.6 | 3.3 | 12.7 |
| Apr. | 3.6 | 3.4 | 3.1 | 12.9 |
| May. | 3.6 | 3.4 | 3.3 | 12.6 |
| June. | 3.7 | 3.3 | 3.3 | 12.7 |
| July. | 3.7 | 3.3 | 3.3 | 12.7 |
| Aug. | 3.7 | 3.3 | 3.3 | 12.5 |
| Sept. | 3.5 | 3.2 | 3.1 | 12.5 |
| Oct. | 3.6 | 3.2 | 3.2 | 12.3 |
| Nov. | 3.5 | 3.2 | 3.2 | 12.0 |
| Dec. | 3.5 | 3.1 | 3.2 | 12.6 |
| 2020: Jan. | 3.6 | 3.3 | 3.2 | 12.2 |
| Feb. | 3.5 | 3.3 | 3.1 | 11.0 |
| Mar. | 4.4 | 4.0 | 4.0 | 14.3 |
| Apr. | 14.7 | 13.0 | 15.5 | 31.9 |
| May. | 13.3 | 11.6 | 13.9 | 29.9 |
| June. | 11.1 | 10.2 | 11.2 | 23.2 |
| July. | 10.2 | 9.4 | 10.5 | 19.3 |
| Aug. | 8.4 | 8.0 | 8.4 | 16.1 |
| Sept. | 7.9 | 7.4 | 7.7 | 15.9 |
| Oct. | 6.9 | 6.7 | 6.5 | 13.9 |
| Nov. | 6.7 | 6.7 | 6.1 | 14.0 |
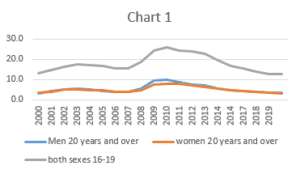
Table 2
| Year or Month | Less than a high school diploma | High school graduates, no college | Some college or associate degree | Bachelor’s degree and higher 4 |
| 2000. | 6.3 | 3.4 | 2.7 | 1.7 |
| 2001. | 7.2 | 4.2 | 3.3 | 2.3 |
| 2002. | 8.4 | 5.3 | 4.5 | 2.9 |
| 2003. | 8.8 | 5.5 | 4.8 | 3.1 |
| 2004. | 8.5 | 5.0 | 4.2 | 2.7 |
| 2005. | 7.6 | 4.7 | 3.9 | 2.3 |
| 2006. | 6.8 | 4.3 | 3.6 | 2.0 |
| 2007. | 7.1 | 4.4 | 3.6 | 2.0 |
| 2008. | 9.0 | 5.7 | 4.6 | 2.6 |
| 2009. | 14.6 | 9.7 | 8.0 | 4.6 |
| 2010. | 14.9 | 10.3 | 8.4 | 4.7 |
| 2011. | 14.1 | 9.4 | 8.0 | 4.3 |
| 2012. | 12.4 | 8.3 | 7.1 | 4.0 |
| 2013. | 11.0 | 7.5 | 6.4 | 3.7 |
| 2014. | 9.0 | 6.0 | 5.4 | 3.2 |
| 2015. | 8.0 | 5.4 | 4.5 | 2.6 |
| 2016. | 7.4 | 5.2 | 4.1 | 2.5 |
| 2017. | 6.5 | 4.6 | 3.8 | 2.3 |
| 2018. | 5.6 | 4.1 | 3.3 | 2.1 |
| 2019. | 5.4 | 3.7 | 3.0 | 2.1 |
| 2019: Jan. | 5.7 | 3.7 | 3.4 | 2.4 |
| Feb. | 5.3 | 3.7 | 3.1 | 2.2 |
| Mar. | 5.8 | 3.7 | 3.4 | 2.0 |
| Apr. | 5.3 | 3.4 | 3.1 | 2.1 |
| May. | 5.4 | 3.6 | 2.8 | 2.1 |
| June. | 5.3 | 3.9 | 3.0 | 2.1 |
| July. | 5.2 | 3.6 | 3.2 | 2.1 |
| Aug. | 5.4 | 3.6 | 3.0 | 2.1 |
| Sept. | 4.8 | 3.6 | 2.9 | 2.0 |
| Oct. | 5.5 | 3.7 | 2.8 | 2.1 |
| Nov. | 5.3 | 3.7 | 2.9 | 2.0 |
| Dec. | 5.2 | 3.7 | 2.7 | 1.9 |
| 2020: Jan. | 5.5 | 3.8 | 2.8 | 2.0 |
| Feb. | 5.7 | 3.6 | 3.0 | 1.9 |
| Mar. | 6.8 | 4.4 | 3.7 | 2.5 |
| Apr. | 21.2 | 17.3 | 15.0 | 8.4 |
| May. | 19.9 | 15.3 | 13.3 | 7.4 |
| June. | 16.6 | 12.1 | 10.9 | 6.9 |
| July. | 15.4 | 10.8 | 10.0 | 6.7 |
| Aug. | 12.6 | 9.8 | 8.0 | 5.3 |
| Sept. | 10.6 | 9.0 | 8.1 | 4.8 |
| Oct. | 9.8 | 8.1 | 6.5 | 4.2 |
| Nov. | 9.0 | 7.7 | 6.3 | 4.2 |
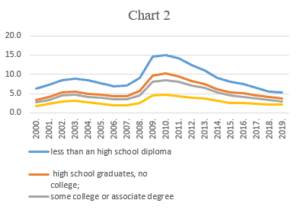
Table 3
| Year or month | Unemployment | Duration of unemployment | Reason for unemployment | ||||||||||
| Less than five weeks | 5–14 weeks | 15–26 weeks | 27 weeks and over | Average (mean) duration (weeks) 2 | Median duration (weeks) | Job losers 3 | Job leavers | Reentrants | New entrants | ||||
| Total | On layoff | Other | |||||||||||
| 2000. | 5,692 | 2,558 | 1,815 | 669 | 649 | 12.6 | 5.9 | 2,517 | 852 | 1,664 | 780 | 1,961 | 434 |
| 2001. | 6,801 | 2,853 | 2,196 | 951 | 801 | 13.1 | 6.8 | 3,476 | 1,067 | 2,409 | 835 | 2,031 | 459 |
| 2002. | 8,378 | 2,893 | 2,580 | 1,369 | 1,535 | 16.6 | 9.1 | 4,607 | 1,124 | 3,483 | 866 | 2,368 | 536 |
| 2003. | 8,774 | 2,785 | 2,612 | 1,442 | 1,936 | 19.2 | 10.1 | 4,838 | 1,121 | 3,717 | 818 | 2,477 | 641 |
| 2004. | 8,149 | 2,696 | 2,382 | 1,293 | 1,779 | 19.6 | 9.8 | 4,197 | 998 | 3,199 | 858 | 2,408 | 686 |
| 2005. | 7,591 | 2,667 | 2,304 | 1,130 | 1,490 | 18.4 | 8.9 | 3,667 | 933 | 2,734 | 872 | 2,386 | 666 |
| 2006. | 7,001 | 2,614 | 2,121 | 1,031 | 1,235 | 16.8 | 8.3 | 3,321 | 921 | 2,400 | 827 | 2,237 | 616 |
| 2007. | 7,078 | 2,542 | 2,232 | 1,061 | 1,243 | 16.8 | 8.5 | 3,515 | 976 | 2,539 | 793 | 2,142 | 627 |
| 2008. | 8,924 | 2,932 | 2,804 | 1,427 | 1,761 | 17.9 | 9.4 | 4,789 | 1,176 | 3,614 | 896 | 2,472 | 766 |
| 2009. | 14,265 | 3,165 | 3,828 | 2,775 | 4,496 | 24.4 | 15.1 | 9,160 | 1,630 | 7,530 | 882 | 3,187 | 1,035 |
| 2010. | 14,825 | 2,771 | 3,267 | 2,371 | 6,415 | 33.0 | 21.4 | 9,250 | 1,431 | 7,819 | 889 | 3,466 | 1,220 |
| 2011. | 13,747 | 2,677 | 2,993 | 2,061 | 6,016 | 39.3 | 21.4 | 8,106 | 1,230 | 6,876 | 956 | 3,401 | 1,284 |
| 2012. | 12,506 | 2,644 | 2,866 | 1,859 | 5,136 | 39.4 | 19.3 | 6,877 | 1,183 | 5,694 | 967 | 3,345 | 1,316 |
| 2013. | 11,460 | 2,584 | 2,759 | 1,807 | 4,310 | 36.5 | 17.0 | 6,073 | 1,136 | 4,937 | 932 | 3,207 | 1,247 |
| 2014. | 9,617 | 2,471 | 2,432 | 1,497 | 3,218 | 33.7 | 14.0 | 4,878 | 1,007 | 3,871 | 824 | 2,829 | 1,086 |
| 2015. | 8,296 | 2,399 | 2,302 | 1,267 | 2,328 | 29.2 | 11.6 | 4,063 | 974 | 3,089 | 819 | 2,535 | 879 |
| 2016. | 7,751 | 2,362 | 2,226 | 1,158 | 2,005 | 27.5 | 10.6 | 3,740 | 966 | 2,774 | 858 | 2,330 | 823 |
| 2017. | 6,982 | 2,270 | 2,008 | 1,017 | 1,687 | 25.0 | 10.0 | 3,434 | 956 | 2,479 | 778 | 2,079 | 690 |
| 2018. | 6,314 | 2,170 | 1,876 | 917 | 1,350 | 22.7 | 9.3 | 2,990 | 852 | 2,138 | 794 | 1,928 | 602 |
| 2019. | 6,001 | 2,086 | 1,789 | 860 | 1,266 | 21.6 | 9.1 | 2,786 | 823 | 1,963 | 814 | 1,810 | 591 |
| 2019: Jan. | 6,516 | 2,319 | 1,999 | 898 | 1,259 | 20.6 | 9.0 | 3,060 | 940 | 2,120 | 816 | 1,944 | 607 |
| Feb. | 6,181 | 2,169 | 1,809 | 928 | 1,279 | 22.0 | 9.4 | 2,863 | 828 | 2,036 | 841 | 1,902 | 619 |
| Mar. | 6,194 | 2,116 | 1,812 | 936 | 1,305 | 22.2 | 9.5 | 2,826 | 866 | 1,959 | 780 | 2,002 | 605 |
| Apr. | 5,850 | 1,906 | 1,835 | 860 | 1,227 | 22.8 | 9.3 | 2,660 | 722 | 1,938 | 728 | 1,899 | 535 |
| May. | 5,938 | 2,158 | 1,572 | 822 | 1,298 | 24.1 | 9.1 | 2,674 | 865 | 1,810 | 809 | 1,850 | 602 |
| June. | 5,985 | 1,949 | 1,832 | 776 | 1,413 | 22.1 | 9.4 | 2,744 | 805 | 1,939 | 889 | 1,850 | 537 |
| July. | 6,027 | 2,222 | 1,795 | 909 | 1,170 | 19.7 | 9.0 | 2,796 | 828 | 1,968 | 832 | 1,794 | 597 |
| Aug. | 5,999 | 2,218 | 1,746 | 831 | 1,251 | 22.1 | 9.0 | 2,864 | 812 | 2,052 | 784 | 1,785 | 577 |
| Sept. | 5,753 | 1,869 | 1,778 | 806 | 1,318 | 21.7 | 9.4 | 2,575 | 729 | 1,846 | 840 | 1,669 | 673 |
| Oct. | 5,857 | 1,978 | 1,747 | 884 | 1,259 | 21.6 | 9.2 | 2,691 | 772 | 1,919 | 846 | 1,698 | 622 |
| Nov. | 5,811 | 2,026 | 1,753 | 865 | 1,219 | 20.2 | 9.2 | 2,804 | 768 | 2,036 | 776 | 1,663 | 581 |
| Dec. | 5,753 | 2,065 | 1,730 | 812 | 1,186 | 20.8 | 9.0 | 2,686 | 807 | 1,880 | 829 | 1,655 | 551 |
| 2020: Jan. | 5,892 | 2,059 | 1,755 | 887 | 1,166 | 21.9 | 9.3 | 2,665 | 742 | 1,923 | 836 | 1,838 | 557 |
| Feb. | 5,787 | 2,013 | 1,803 | 825 | 1,102 | 20.9 | 9.1 | 2,723 | 801 | 1,922 | 777 | 1,803 | 505 |
| Mar. | 7,140 | 3,542 | 1,794 | 808 | 1,164 | 17.1 | 7.0 | 3,946 | 1,848 | 2,099 | 727 | 1,778 | 509 |
| Apr. | 23,078 | 14,283 | 7,004 | 833 | 939 | 6.1 | 2.0 | 20,626 | 18,063 | 2,563 | 570 | 1,477 | 389 |
| May. | 20,985 | 3,875 | 14,814 | 1,078 | 1,164 | 9.9 | 7.7 | 18,291 | 15,343 | 2,948 | 554 | 1,645 | 536 |
| June. | 17,750 | 2,838 | 11,496 | 1,903 | 1,391 | 15.7 | 13.6 | 14,272 | 10,565 | 3,707 | 565 | 2,356 | 563 |
| July. | 16,338 | 3,202 | 5,169 | 6,484 | 1,501 | 17.9 | 15.0 | 12,924 | 9,225 | 3,699 | 571 | 2,358 | 513 |
| Aug. | 13,550 | 2,281 | 3,134 | 6,517 | 1,624 | 20.2 | 16.7 | 10,307 | 6,160 | 4,147 | 589 | 2,095 | 554 |
| Sept. | 12,580 | 2,552 | 2,732 | 4,918 | 2,405 | 20.7 | 17.8 | 9,135 | 4,637 | 4,498 | 801 | 2,146 | 537 |
| Oct. | 11,061 | 2,500 | 2,275 | 2,617 | 3,556 | 21.2 | 19.3 | 7,712 | 3,205 | 4,507 | 769 | 2,009 | 528 |
| Nov. | 10,735 | 2,467 | 2,413 | 1,857 | 3,941 | 23.2 | 18.8 | 7,485 | 2,764 | 4,721 | 721 | 1,924 | 560 |
Since the start of the millennium, 2010 recorded the highest unemployment at 14,825. On the other hand, 2000 recorded the lowest unemployment rate with 5 692 (Govinfo, (n.d.). The growth rate in unemployment between the two groups is 1.6%. Although the percentage may seem small, it equals 9 133 people.
The unemployment rate decreases with an increase in the education level. The unemployment rate is highest among the group with less than a high school diploma and least in the group with a bachelor’s degree. Thus, one can conclude that as one advances in educational attainment, the chances of unemployment decrease. The year with the highest unemployment rate by duration was 2012, with 39.4 weeks on average (Govinfo, (n.d.). The above means that over 75% of the unemployed individuals in the labor force were jobless and seeking jobs.
An increase in teenagers and minorities will not affect the natural employment rate. Contrarily, the unemployment rate may decrease, increasing the potential or GDP for future years. Statistics indicate that teenagers and minorities have the highest unemployment rate across the years. An increase in the number would mean an increase in the number of teens who find jobs, hence bolstering the economy.
The data above is critical in analyzing and projecting a fall in unemployment. Unemployed people may apply the data to comprehend their issues when searching for a job in a recession economy. Moreover, the above exercise has helped me comprehend the economy, particularly the primary supply and demand trends. It has developed my interest in researching the economy more as I progress in my studies and career.
References
Govinfo. (n.d.). Economic Report of the President. Govinfo | U.S. Government Publishing Office. https://www.govinfo.gov/app/collection/erp/2021
U.S. Bureau of Labor Statistics. (2022a). Consumer price index. U.S. Bureau of Labor Statistics https://www.bls.gov/news.release/cpi.toc.htm
U.S Bureau of Labor Statistics. (2022b). Employment situation. U.S. Bureau of Labor Statistics. https://www.bls.gov/news.release/empsit.toc.htm
ORDER A PLAGIARISM-FREE PAPER HERE
We’ll write everything from scratch
Question 
Data Exercise
Format of the Project:
The Data Exercise must be posted to the LEO Student Assignments as attachments are limited to a maximum of two files in doc, docx., and xls. xlsx., or rtf. Formats. OTHER FORMATS ARE NOT ACCEPTABLE and will not be reviewed or graded.
Please note that these are hand-written and scanned works, pdf: files, jpg. Files, as well as files posted in Google Drive, will not be accepted or graded.
Please note that starting from the Fall 2020 semester, the UMGC moved to the 7th Edition of the APA Style. The links to the 7th Edition of the APA Style methodology are posted in Content – Course Resources – Writing Resources.
No more than 20% of the project’s text should be made up of quotes.
Please note that using the 7th Edition APA Citation Methodology is required for all parts of the assignment. Written projects:
1. Must be typed, double-spaced, in 12-point Times New Roman or Arial font, with one-
inch margins
2. Must have the title page in APA-7th style
3. Must have in-text citations in APA-7th edition style
4. Must have a reference list in APA-7th edition style. Please note that you must reference the
data you are using for the project
5. Must be prepared using word processing software (Microsoft Word preferred)
DATA EXERCISE #2
It consists of three parts
Part 1: The Unemployment Rate (weight 30% of the assignment grade)
Complete the following exercise
Visit the Bureau of Labor Statistics Web Site, www.bls.gov/news.release/empsit.toc.htm
(http://www.bls.gov/news.release/empsit.toc.htm). Select Employment Situation Summary.
Please note that using the data from previously published releases and summaries will produce a grade of zero for this part of the project.
Write a report (1 – 2 pages double spaced) in your own words to answer the questions:
1. What month (and year) is summarized? What was the unemployment rate for that month?
How does that rate compare with the rate in the previous month?
2. What were the unemployment rates for adult women, teenagers, blacks, Hispanics, and whites? How did these rates compare with those a month earlier?
3. What factors make it difficult to determine the unemployment rate?
4. Why is unemployment an economic problem?
5. What are the noneconomic effects of unemployment?
6. Who loses from unemployment?
7. Please analyze and discuss the significance of the data you received for this data exercise.
8. Reflect on what you have learned from this exercise.
Part 2: The Inflation Rate (weight 30% of the assignment grade) Complete the following exercise:
Visit the Bureau of Labor Statistics Web Site,www.bls.gov/news.release/cpi.toc.htm(http://www.bls.gov/news.release/cpi.toc.htm). You will be using “Consumer Price Index Summary” and the “Table 1 Consumer Price Index for All UrbanConsumers (CPI-U): U. S. city average, by expenditure category “.
Please note that using the data from previously published releases and summaries will produce a grade of zero for this part of the project. Write a report (1 – 2 pages double spaced) in your own words to answer the questions:
1. What month (and year) is summarized? What was the level of the CPIU for that month?
(See Table 1, “Consumer Price Index for All Urban Consumers”). What does this number
represent?
2. What was the inflation rate (percentage change in the CPIU) for the last
month? How does that rate of inflation compare with the rate in the previous month?
3. What was the inflation rate (percentage change in the CPIU) for the last 12 months for
“all items”?
4. Which two categories of goods or services had the greatest price increase for the last 12
months? Which two categories of goods or services had the lowest price increase for the
last 12 months?
5. Which two categories of goods or services had the largest price decrease for the last 12
months?
6. Who loses from inflation?
7. Who benefits from inflation?
8. Please analyze and discuss the significance of the data that you received for this
Data Exercise.
9. Reflect on what you have learned from this exercise.
Part 3: Unemployment Data by Labor Force Groups and Duration (30% of the project
grade)
Go to https://www.govinfo.gov/app/collection/erp
This is the home page of the President’s Economic Report.
Click on the last available Report, scroll down, and download individual tables as Excel.
Please note that using the data from previous Reports will produce a grade of zero for this part
of the project.
1. Find unemployment data (Table B–27.—Civilian unemployment rate) for each year from 2000 to the present. Use three labor force groups: men 20 years and over, women 20 years and over, and both sexes 16 to 19 years of age.
a. Present the result in your project as a table.
b. Create one or more charts (line graph, bar graph, etc.).
2. Find unemployment data (Table B–27.—Civilian unemployment rate) for each year 2000 to present by educational attainment (25 years and over). Use the following groups: less than a high school diploma; high school graduates, no college; some college or associate degree; bachelor’s degree and higher.
a. Present the result in your project as a table.
b. Create one or more charts (line graph, bar graph, etc.).
3. Use the President’s Economic Report (Table B–28.—Unemployment by duration and reason) to find data on the duration of unemployment for each year from 2000 to the present.
a. Present the result in your project as a table.
b. Create one or more charts (line graph, bar graph, etc.).
Write a report (2 pages double-spaced) about the results you received in your own words.
In this paper, consider, but do not be limited to the following:
1. Which years had the highest and lowest unemployment rates? How do the rates compare
among these groups?
2. Compare the unemployment rates by educational attainment. How do the rates compare among these groups? What relationship, if any, do you find?
3. Compare the distribution of unemployment by duration over these years. Which years had the highest and lowest unemployment duration? What relationship, if any, do you find?
4. Demographic studies show that the proportion of teenagers and minorities in the U.S. population will likely increase shortly. In your opinion, what implications, if any, will this trend have on the unemployment rate?
5. Please analyze and discuss the significance of the data you received for this data exercise.
6. Reflect on what you have learned from this exercise.
PRESENTATION OF THE DATA EXERCISE AND USE OF APA CITATION
METHODOLOGY (10%) of the project grade):
-Organization, Format, and Presentation of the Data Exercise. The project should have a title page. Each part of the Data Exercise must begin with sub-headings. Please use the sub-headings included in the assignment. Please use double space, one-inch margins, and 12-point Times New Roman font. (3% of the project grade)
Use Tables, Figures, and Other Graphics to Summarize and Support the Analysis Presented in the paper. All tables and charts should have a numbering system, like “Table 1…”, the title, and the note to reference the source of information. (3% of the project grade)
Research Sources and Significance of Research Information and Data, Use of APA Citation Methodology (4% of the project grade).