Course Project Worksheet – Mean, Median, and Mode
Complete Parts A and B below.
Part A
Independent Variable 1
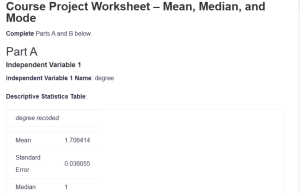
Independent Variable 1 Name: degree
Descriptive Statistics Table:
| degree recoded | |
| Mean | 1.706414 |
| Standard Error | 0.036055 |
| Median | 1 |
| Mode | 1 |
| Standard Deviation | 1.199602 |
| Sample Variance | 1.439046 |
| Kurtosis | -0.85605 |
| Skewness | 0.601744 |
| Range | 4 |
| Minimum | 0 |
| Maximum | 4 |
| Sum | 1889 |
| Count | 1107 |
Summary and Description:
The Education Level variable (degree), coded from 0 to 4, represents the respondents’ highest degree attained, from less than high school to a graduate degree. The mean degree level was 1.71, indicating a central tendency toward high school-level education, with the median and mode both at 1. This central clustering reflects a predominant high school-level education among respondents, with a limited representation of graduate degree holders. With a standard deviation of 1.20, the data shows moderate variability, capturing diverse educational attainment but with a skew toward lower education levels, possibly reflective of broader population trends.
Independent Variable 2
Independent Variable 2 Name: polviews
Descriptive Statistics Table:
| polviews recoded | |
| Mean | 4.084011 |
| Standard Error | 0.044378 |
| Median | 4 |
| Mode | 4 |
| Standard Deviation | 1.476515 |
| Sample Variance | 2.180097 |
| Kurtosis | -0.46583 |
| Skewness | -0.11632 |
| Range | 6 |
| Minimum | 1 |
| Maximum | 7 |
| Sum | 4521 |
| Count | 1107 |
Summary and Description:
Political Views (polviews) range from 1 (extremely liberal) to 7 (extremely conservative), average at a mean score of 4.08. This central score, along with a median and mode of 4, indicates that most respondents identify as moderate. The standard deviation of 1.48 reflects a fairly balanced spread across the spectrum from liberal to conservative views, indicating ideological diversity in the sample. The slight negative skew suggests a mild leaning toward more liberal stances, though the distribution remains relatively balanced around the midpoint. This variable provides a nuanced snapshot of political ideology within the surveyed group.
Dependent Variable
Dependent Variable Name: natheal
Descriptive Statistics Table:
| natheal recoded | |
| Mean | 1.31617 |
| Standard Error | 0.016892 |
| Median | 1 |
| Mode | 1 |
| Standard Deviation | 0.562014 |
| Sample Variance | 0.315859 |
| Kurtosis | 1.572727 |
| Skewness | 1.600474 |
| Range | 2 |
| Minimum | 1 |
| Maximum | 3 |
| Sum | 1457 |
| Count | 1107 |
Summary and Description:
Healthcare Spending, coded from 1 (too little) to 3 (too much), shows a mean of 1.32, suggesting a predominant perception that current spending on healthcare is insufficient. With the median and mode both at 1, the data indicates a strong consensus among respondents in favor of increased spending. The standard deviation of 0.56 points to low variability, highlighting general agreement on this issue. Skewness and kurtosis values further support this clustering around “too little” spending, providing valuable insights into public opinion on national healthcare investment.
Part B
Respond to the following questions.
- What are some considerations for choosing a measure of central tendency?
When selecting a measure of central tendency, it is crucial to consider the variable type and distribution. For instance, the mean is best for interval or ratio data without significant outliers, as it offers a precise average. The median is preferred for skewed distributions or ordinal data, as it is resistant to outliers and reflects the central point. Mode is often suitable for categorical data, identifying the most frequent response. Choosing the appropriate measure can ensure meaningful, accurate insights from the data (Field, 2018).
- What impact do variable types have on testing when considering central tendency?
The variable type significantly influences the choice of statistical tests and the interpretation of central tendency measures. For example, ordinal variables benefit from the median or mode, as their rankings do not imply equal intervals, while interval or ratio variables can utilize the mean for more nuanced analysis. Nominal data restricts central tendency to the mode due to its categorical nature. Trochim et al. (2016) note that understanding variable types helps in accurately capturing the data’s characteristics, ensuring that conclusions drawn align with the variable’s nature.
- Which measure of central tendency was most appropriate for each of your variables? Why?
For Education Level or the degree variable, the mode is most appropriate, highlighting the most common degree level attained among respondents. For Political Views (polviews), the median best represents the central ideology, providing a balanced view without skewing toward extremes. For Healthcare Spending (natheal), the mode is also suitable as it reflects the most prevalent opinion regarding spending levels, aligning with the variable’s ordinal nature. Each measure offers the clearest representation of central tendencies based on the variable’s distribution and data type (Gravetter & Wallnau, 2017).
References
Field, A. (2018). Discovering statistics using IBM SPSS statistics (5th ed.). Sage Publications.
Gravetter, F. J., & Wallnau, L. B. (2017). Statistics for the behavioral sciences (10th ed.). Cengage Learning.
Trochim, W. M. K., Donnelly, J. P., & Arora, K. (2016). Research methods: The essential knowledge base. Cengage Learning.
ORDER A PLAGIARISM-FREE PAPER HERE
We’ll write everything from scratch
Question 
Complete Parts A and B below.
Part A
Using the three variables you chose in Week 1, complete the following for each of your variables:
- Using Excel, calculate the mean, median, and mode for each variable.
- Create APA formatted tables to represent the mean, median, and mode of each variable. Copy and paste each table below.
- Explain/summarize the output for each variable.
Note: You might have to recode your variables prior to completing this assignment. See Calculating Mean, Median, and Mode in Excel for the step-by-step process.
Independent Variable 1
Independent Variable 1 Name: [Enter independent variable 1 here.]
Descriptive Statistics Table:
[Paste your table here.]
Summary and Description:
[Enter your summary and description here.]
Independent Variable 2
Independent Variable 2 Name: [Enter independent variable 2 here.]
Descriptive Statistics Table:
[Paste your table here.]
Summary and Description:
[Enter your summary and description here.]
Dependent Variable
Dependent Variable Name: [Enter dependent variable here.]
Descriptive Statistics Table:
[Paste your table here.]
Summary and Description:
[Enter your summary and description here.]
Course Project Worksheet – Mean, Median, and Mode
Part B
Respond to the following questions.
- What are some considerations for choosing a measure of central tendency?
[Enter your response here.]
- What impact do variable types have on testing when considering central tendency?
[Enter your responses here.]
- Which measure of central tendency was most appropriate for each of your variables? Why?
[Enter your response here.]
References
[List references according to APA guidelines.]