Chapter 3 Questions
Question 1
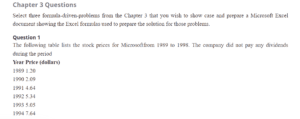
The following table lists the stock prices for Microsoft from 1989 to 1998. The company did not pay any dividends during the period
Year Price (dollars)
1989 1.20
1990 2.09
1991 4.64
1992 5.34
1993 5.05
1994 7.64
1995 10.97
1996 20.66
1997 32.31
1998 69.34
a. Estimate the average annual return you would have made on your investment.
b. Estimate the standard deviation and variance in annual returns.
c. If you were investing in Microsoft today, would you expect the historical standard deviations and variances to continue to hold? Why or why not?
| Question 1 | ||||||
| Year | Price | Return | %Return | R-AR | %(R-AR) | %(R-AR) SQUARED |
| 1989 | 1.2 | 0 | 0 | 0 | 0 | |
| 1990 | 2.09 | 0.741666667 | 74.16666667 | 11.94058893 | 0.119405889 | 0.014257766 |
| 1991 | 4.64 | 1.220095694 | 122.0095694 | 59.78349164 | 0.597834916 | 0.357406587 |
| 1992 | 5.34 | 0.150862069 | 15.0862069 | -47.13987084 | -0.471398708 | 0.222216742 |
| 1993 | 5.05 | -0.054307116 | -5.43071161 | -67.66 | -0.6766 | 0.45778756 |
| 1994 | 7.64 | 0.512871287 | 51.28712871 | -10.93894903 | -0.10938949 | 0.011966061 |
| 1995 | 10.97 | 0.435863874 | 43.58638743 | -18.6396903 | -0.186396903 | 0.034743805 |
| 1996 | 20.66 | 0.88331814 | 88.33181404 | 26.1057363 | 0.261057363 | 0.068150947 |
| 1997 | 32.31 | 0.563891578 | 56.38915779 | -5.836919947 | -0.058369199 | 0.003406963 |
| 1998 | 69.34 | 1.146084803 | 114.6084803 | 52.38240261 | 0.523824026 | 0.27439161 |
| 159.24 | 1592.4 | 560.0346997 | 560.0346997 | 5.600346997 | 1.444328043 | |
| 62.22607774 | ||||||
| Variance | 0.180541005 | |||||
| Standard Deviation | 0.424901171 |
Are you looking for an untouched version of “Chapter 3 Questions accounting help”? Reach out to us; we are ready to help.
Question 2
Unicom is a regulated utility serving Northern Illinois. The following table lists Unicom’s stock prices and dividends from 1989 to 1998.
Year Price (dollars) Dividends (dollars)
1989 36.10 3.00
1990 33.60 3.00
1991 37.80 3.00
1992 30.90 2.30
1993 26.80 1.60
1994 24.80 1.60
1995 31.60 1.60
1996 28.50 1.60
1997 24.25 1.60
1998 35.60 1.60
a. Estimate the average annual return you would have made on your investment.
b. Estimate the standard deviation and variance in annual returns.
c. If you were investing in Unicom today, would you expect the historical standard deviations and variances to continue to hold? Why or why not?
| Question 2 | |||||
| Year | Price | Dividends | Annual Returns | Deviation= Annual Return -Average Annual Return | Deviation Squared |
| 1989 | 36.1 | 3 | 0.083102493 | 0.01629239 | 0.000265442 |
| 1990 | 33.6 | 3 | 0.089285714 | 0.089285714 | 0.007971939 |
| 1991 | 37.8 | 3 | 0.079365079 | 0.079365079 | 0.006298816 |
| 1992 | 30.9 | 2.3 | 0.074433657 | 0.074433657 | 0.005540369 |
| 1993 | 26.8 | 1.6 | 0.059701493 | 0.059701493 | 0.003564268 |
| 1994 | 24.8 | 1.6 | 0.064516129 | 0.064516129 | 0.004162331 |
| 1995 | 31.6 | 1.6 | 0.050632911 | 0.050632911 | 0.002563692 |
| 1996 | 28.5 | 1.6 | 0.056140351 | 0.056140351 | 0.003151739 |
| 1997 | 24.25 | 1.6 | 0.065979381 | 0.065979381 | 0.004353279 |
| 1998 | 35.6 | 1.6 | 0.04494382 | 0.04494382 | 0.002019947 |
| 0.066810103 | 0.601290926 | 0.003989182 | |||
| STANDARD DEVIATION (Square root Variance) | 0.063159973 |
Question 11
Every capital asset pricing model investor owns a combination of the market portfolio and a riskless asset. Assume that the standard deviation of the market portfolio is 30% and the expected return on the portfolio is 15%. What proportion of the following investor’s wealth would you suggest investing in the market portfolio, and what proportion in the riskless asset? (The riskless asset has an expected return of 5%)
a. An investor who desires a portfolio with no standard deviation.
b. An investor who desires a portfolio with a standard deviation of 15%.
c. An investor who desires a portfolio with a standard deviation of 30%.
d. An investor who desires a portfolio with a standard deviation of 45%.
e. An investor who desires a portfolio with an expected return of 12%.
| Question 11 | ||||
| A | Portfolio with no standard deviation in the market portfolio | 0% | 15% | 0% |
| Proportion in the riskless asset | 1 | 0% | 100% | |
| B | Portfolio with a standard deviation of 15% in the market portfolio | 15% | 15% | 100% |
| Proportion in the riskless asset | 1 | 100% | 0% | |
| C | Portfolio with a standard deviation of 30% in the market portfolio | 30% | 15% | 200% |
| Proportion in the riskless asset | 1 | 200% | -100% | |
| D | Portfolio with a standard deviation of 45% proportion of the market portfolio | 45% | 15% | 300% |
| Proportion in the riskless asset | 1 | 300% | -200% | |
| E | Portfolio with an expected return of 12% | 12% | 15% | 80.0% |
Other Related Post: Create a Budget and Financial Plan for a Vacation Trip
References
Damodaran, A. (2010). Applied corporate finance. John Wiley & Sons.
ORDER A PLAGIARISM-FREE PAPER HERE
We’ll write everything from scratch
Question 
Chapter 3 Questions
Select three formula-driven problems from Chapter 3 that you wish to showcase and prepare a Microsoft Excel document showing the formulas used to prepare the solution for those problems.
Chapter 3 Questions
Question 1
The following table lists the stock prices for Microsoft from 1989 to 1998. The company did not pay any dividends during the period
Year Price (dollars)
1989 1.20
1990 2.09
1991 4.64
1992 5.34
1993 5.05
1994 7.64
1995 10.97
1996 20.66
1997 32.31
1998 69.34
a. Estimate the average annual return you would have made on your investment.
b. Estimate the standard deviation and variance in annual returns.
c. If you were investing in Microsoft today, would you expect the historical standard deviations and variances to continue to hold? Why or why not?
Question 2
Unicom is a regulated utility serving Northern Illinois. The following table lists Unicom’s stock prices and dividends from 1989 to 1998.
Year Price (dollars) Dividends (dollars)
1989 36.10 3.00
1990 33.60 3.00
1991 37.80 3.00
1992 30.90 2.30
1993 26.80 1.60
1994 24.80 1.60
1995 31.60 1.60
1996 28.50 1.60
1997 24.25 1.60
1998 35.60 1.60
a. Estimate the average annual return you would have made on your investment.
b. Estimate the standard deviation and variance in annual returns.
c. If you were investing in Unicom today, would you expect the historical standard deviations and variances to continue to hold? Why or why not?
Question 11
Every capital asset pricing model investor owns a combination of the market portfolio and a riskless asset. Assume that the standard deviation of the market portfolio is 30% and the expected return on the portfolio is 15%. What proportion of the following investor’s wealth would you suggest investing in the market portfolio, and what proportion in the riskless asset? (The riskless asset has an expected return of 5%)
a. An investor who desires a portfolio with no standard deviation.
b. An investor who desires a portfolio with a standard deviation of 15%.
c. An investor who desires a portfolio with a standard deviation of 30%.
d. An investor who desires a portfolio with a standard deviation of 45%.
e. An investor who desires a portfolio with an expected return of 12%.