Calculating Sell-Thru and Penetration
Calculating the Sell-thru of the Sweater
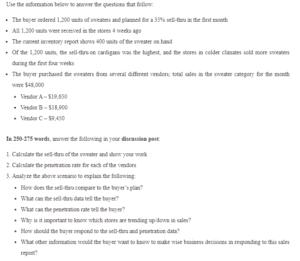
Sell-thru is the ratio or fraction of the items sold divided by the amount purchased or merchandise shipped to the store (Flores et al., 2014). It shows the percentage of sold items, either in dollars or units. The buyer sent 1200 sweaters at the beginning of the month, and the current inventory record shows a remaining stock of 400 units. Thus, the sell-thru rate is 800 (sold units) divided by 1200 (ordered units), multiplied by 100. (800/1200*100) = 66.66 or 67%.
Calculating the Penetration Rate for Each of the Vendors
The penetration rate is calculated by dividing the number of customers a vendor has by the target market size, dividing each vendor’s total sales by the total sales achieved in a given period, and multiplying the result by 100 (Cagliano et al., 2014). Thus, Vendor A’s penetration rate is (19650/48000*100) = 40.94% or 41%, Vendor B’s is (18900/48000*100) =39.36% or 39%, and Vendor C’s is (9450/48000*100) =19.69% or 20%.
Analyzing the Scenario
The sweaters’ sell-thru is impressive compared to the buyer’s plan, considering that it is 67% higher than the buyer’s initial plan of 35%. The sell-thru data can tell the buyer whether these specific cardigans are popular with the targeted market. The penetration rate can refer to the buyer size of the target market and the percentage of customers buying their products. It can also mean the actions required to gain a larger market share and overtake the competing vendors.
For several reasons, knowing which stores are trending up or down in sales is essential. On the one hand, knowing the stores that are up for sale will be critical in ordering more cardigans to ensure the stores do not run out of stock. On the other hand, identifying the stores trending down in sales will be critical in ensuring that more sweaters are not shipped to such stores to avoid dead stock and identifying strategies to increase sales.
Therefore, the buyer should respond to the sell-thru and penetration rate data by purchasing more units of the same sweaters and ensuring that stores with up-trending sales are adequately stocked. Additionally, the data can be used to design strategies to increase store sales with down-trending sales and ensure that the stock is not held in such stores.
Other information the buyer would want to know to make wise business decisions in responding to this sales report includes the target market’s demography and income levels. This information would be critical in determining marketing and pricing prices to increase the market penetration and sell-thru rate.
References
Cagliano, A. C., Marco, A. D., Rafele, C., Bragagnini, A., & Gobbato, L. (2014). Analyzing the Diffusion of a Mobile Service Supporting the E-grocery Supply Chain. Business Process Management Journal, 928-963.
Flores, J. E., Boada, P., & Moscoso, P. (2014). An Empirical Analysis of Sell-through in a Fashion Setting. International Journal of Supply Chain Management, 13-22.
ORDER A PLAGIARISM-FREE PAPER HERE
We’ll write everything from scratch
Question

Calculating Sell-Thru and Penetration
Use the information below to answer the questions that follow:
- The buyer ordered 1,200 units of sweaters and planned for a 35% sell-thru in the first month
- All 1,200 units were received in the stores four weeks ago
- The current inventory report shows 400 units of the sweater on hand
- Of the 1,200 units, the sell-thru on cardigans was the highest, and the stores in colder climates sold more sweaters during the first four weeks
- The buyer purchased the sweaters from several different vendors; total sales in the sweater category for the month were $48,000
- Vendor A – $19,650
- Vendor B – $18,900
- Vendor C – $9,450
In 250-275 words, answer the following in your discussion post:
- Calculate the sell-thru of the sweater and show your work
- Calculate the penetration rate for each of the vendors
- Analyze the above scenario to explain the following:
-
-
- How does the sell-thru compare to the buyer’s plan?
- What can the sell-thru data tell the buyer?
- What can the penetration rate say to the buyer?
- Why is it important to know which stores are trending up/down in sales?
- How should the buyer respond to the sell-thru and penetration data?
- What other information would the buyer want to know to make wise business decisions regarding this sales report?
-

