Benchmarks and Quality Measures – Diabetes Care
Proposal: Data Compatibility and HIE for Diabetes Care Study
This proposal discusses the quality of diabetic care provided by the physician group. This paper outlines the effect of quality-of-care review that data compatibility has on patients with diabetes receiving treatment from a doctor’s group. There will be no misinterpretation or wrong inference if all data is compatible and there is no confusion. Benchmarks and quality measures will be employed to compare the office data related to diabetic care to some established national or state standard. This analysis aims to ensure that the physician group meets the established healthcare standard and identifies the areas that need improvement.
Data Compatibility
To achieve this, data collected must be standardized and matched across all sources. A second approach is the adoption of standardized coding systems, for example, ICD-10 for diagnoses, RxNorm for medications, and LOINC for laboratory results (Ehrenstein et al., 2020). This allows all data from various sources, such as electronic health records (EHR), pharmacy, and laboratory management systems, to be standardized and thus compared accurately.
When comparing national or state trends with office data, it is necessary to ensure that the benchmarks are really applicable to the specific patient population. For example, diabetes control measured with hemoglobin A1c levels from office data and national databases must represent similar demographic and clinical characteristics, such as age group, comorbidities, and treatment regimen (Masuch et al., 2019). This way, ‘apples are compared with apples,’ and quality assessment can be undertaken.
Inconsistency of data formats could create difficulties in standardizing data. For example, a common case is laboratory results that may be measured by different units and/or formats, which require careful conversion and normalization. Another challenge will be to ensure that the statistical methodologies of the databases used are commensurate when referred to externally, in contrast with those used in analyzing the office’s patient data. Inconsistency in statistical methods can have the power to render comparisons invalid.
Impact of the Quality of Health Information on HIE
Since it supports real-time sharing of clinical information among healthcare providers, quality information shared through HIEs can actually support patient care coordination. Incomplete or incorrect information entered into an HIE can result in treatment delays, misdiagnoses, or inappropriate care. For example, if a patient’s medication history has been incorrectly entered into the HIE, it can mean that when a new prescription is made, there may be a chance of prescribing contraindicated drugs. Inaccurate data also undermines efforts in public health as far as statistical analysis, used to spot trends or assess whether different treatments are working effectively, is concerned.
In a similar connection, incomplete or incorrect information that might be submitted to the national database could misrepresent the quality of care provided to flawed benchmarks. It could further lead to misguided policy modifications or wrong conclusions concerning healthcare practices at the national or local levels.
Conclusion
It is, therefore, of the essence to have compatible data from numerous sources so that the correct status can be ascertained in relation to the quality of diabetes care in this proposal. Data from the office can only be meaningfully compared to the national or state benchmarks if the same format and statistical methods are used in the data collection. Secondly, HIEs and national databases must generate high-quality data to ensure incorrect conclusions about quality are not made to compromise patient care and public health policies.
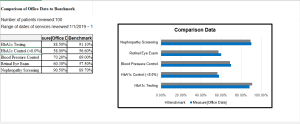
Dashboard Tracking
See the Excel sheet
References
Ehrenstein, V., Kharrazi, H., Lehmann, H., & Taylor, C. O. (2020). Obtaining Data From Electronic Health Records. In www.ncbi.nlm.nih.gov. Agency for Healthcare Research and Quality (US). https://www.ncbi.nlm.nih.gov/books/NBK551878/
Masuch, A., Friedrich, N., Roth, J., Nauck, M., Müller, U. A., & Petersmann, A. (2019). Preventing misdiagnosis of diabetes in the elderly: age-dependent HbA1c reference intervals derived from two population-based study cohorts. BMC Endocrine Disorders, 19(1). https://doi.org/10.1186/s12902-019-0338-7
ORDER A PLAGIARISM-FREE PAPER HERE
We’ll write everything from scratch
Question 
Identify the benchmarks and quality measures used to compare to the office data for your proposal (Excel spreadsheet). Assess the compatibility of the proposed data and examine potential issues related to information quality (1–3 pages).
Benchmarks and Quality Measures – Diabetes Care
Expand All
Introduction
A key part of your proposal will be to identify benchmarks and trends for the topic you have chosen for your documentation review. Benchmarks can come from national or state quality standards or trends. If your proposal is approved, you as the office manager will want to try to answer this question: How does our office data compare to national or state trends?
You need to identify your benchmarks before you can collect and then compare the data. You decide what your benchmarks are. They could be based on national averages, state averages, or quality standards. For example, here is one quality standard: All patients with chronic, stable coronary artery disease are on an antiplatelet therapy or have supporting documentation as to why they cannot take an antiplatelet therapy. For instance, they may have an allergy.
Another question to consider when establishing benchmarks is this: Are you comparing apples to apples or apples to oranges? In addition, if you are retrieving information from a national database or data from an HIE, how do you know your office data is comparable to the information you are retrieving? Consult your suggested resources for answers to these questions.
For this second assessment, you are to:
Analyze statistical trends and assess quality measures relevant to your proposal.
Assess the compatibility of data drawn from multiple sources.
Determine the effects of health information quality on an HIE.
This assessment is completed in three steps:
Step One – Preparation: Locate data related to quality measures or trends relevant to your topic from specific websites.
Step Two – Data Collection: Create a data collection tracking spreadsheet and dashboard.
Step Three – Data Compatibility: Write a short paper on data compatibility and quality.
Please study this assessment’s scoring guide to better understand the performance levels relating to each criterion on which you will be evaluated.
Instructions
Step One: Preparation
Locate data related to quality measures relevant to your topic from one or more of these websites:
Agency for Healthcare Research and Quality. (n.d.). https://www.ahrq.gov/
Centers for Disease Control and Prevention. (n.d.). https://www.cdc.gov/
The Joint Commission. (n.d.). https://www.jointcommission.org/
NCQA. (n.d.). https://www.ncqa.org/
Occupational Safety and Health Administration. (n.d.). https://www.osha.gov/index.html
Any other site that contains national or state health care quality measures.
Step Two: Data Collection
Using the Data Collection Spreadsheet Guide [XLSX] Download Data Collection Spreadsheet Guide [XLSX]as an example, ;create a spreadsheet containing three tabs: Dashboard Tracking, Data Collection, and Trending.
On the first tab, Dashboard Tracking, draw from the information you gathered in Step One as part of your preparation for this assessment:
Identify the specific benchmark data you will compare with your office data. Remember it is up to you to establish your benchmarks.
Organize or create a spreadsheet to display the totals, percentages, averages, and so on of your office data and of the national or state data you will be using for comparison. Note: Your Office Data column will be blank because you are not collecting any office data. This is only a proposal to do an information review of the quality of care provided by the physician group. Data does, however, need to appear in the Benchmark (national/state) data column.
Include at least one comparison graph of your choice on this tab.
On the second tab, Data Collection, draw from the information you gathered in Step One as part of your preparation for this assessment:
Create a form you will use to collect specific data from the patients’ records.
Include a row for each patient.
Provide a column for each data collection point (quality measure) you will be comparing.
Note: The information on this page is totaled, averaged, et cetera, with the results linked to the first tab.
To create your third tab, Trends, you will need to do some additional research. Identify national benchmarks for the condition you have chosen that could be compared to your office data. For example, if the trend in your office is that you are seeing more patients with asthma, but the national trend is decreasing, you have discovered a discrepancy that needs to be investigated.
To perform your analysis:
Visit one or more of the following websites containing national data:
Agency for Healthcare Research and Quality. (n.d.). Healthcare cost and utilization project. https://hcupnet.ahrq.gov/#setup
Centers for Disease Control and Prevention. (n.d.). CDC WONDER. https://wonder.cdc.gov/WelcomeT.html
Any other site that contains national or state health care data.
Locate and analyze statistical data relevant to the selected condition.
Examine trends:
What other meaningful trends exist? For example, consider the number of new cases, increases or decreases of cases within a specific age range or location, et cetera.
How do the national and state trends compare?
Is the national trend increasing or decreasing?
What is the percentage of cases who expire from the disease?
Identify the trending of one statistical result relating to the condition you selected over the last 5–10 years.
Create a line graph on the third tab of your spreadsheet, Trends, that illustrates the national and/or state trending of the disease you selected over the past 5–10 years.
Note: Remember you have not collected your office data yet for comparison purposes. You could add that data at a later time.
Step 3: Data Compatibility
Write a short section to add to the proposal you will complete in Assessment 3. Be sure this section of your proposal includes all of the following headings and your narrative addresses each of the bullet points.
Introduction
Provide a brief 1–2 sentence, high-level summary explaining data compatibility.
Data Compatibility
Assess the compatibility of the data:
How can you ensure data from multiple sources is compatible?
How do you know the data you are using for comparison is compatible with your office data?
What challenges are associated with data standardization? We do not want to compare apples with oranges. You want to be sure data from multiple sources:
Represents the same condition.
Uses similar statistical analysis.
And so on.
Effects of Health Information Quality on the HIE
Explain the difference between an HIE and a national database.
Explain what problems can develop if facilities submit incomplete or inaccurate information to an HIE.
Explain what problems can develop if facilities submit incomplete or inaccurate information to a national database.
Explain how incomplete or inaccurate data may affect your proposal.
Conclusion
Briefly reinforce your paper’s main points.
Additional Requirements
Your assessment should meet the following requirements:
Excel spreadsheet: Your spreadsheet must contain three tabs, be organized, contain appropriate graphs, and have correct spelling.
Written communication: Your paper needs to be clear and well organized, with correct spelling, grammar, and syntax, to support orderly exposition of content.
Title page: Develop a descriptive title of approximately 5–15 words. It should stir interest yet maintain professional decorum.
References: Include a minimum of two citations of peer-reviewed sources in current APA format.
Length: 1–3 typed, double-spaced content pages, not including the title page and references page.
Font and font size: Times New Roman, 12 point.
Competencies Measured
By successfully completing this assessment, you will demonstrate your proficiency in the following course competencies and scoring guide criteria:
Competency 4: Determine how a health information exchange (HIE) or other external health care databases affect the management of patient data, clinical knowledge, and population data.
Assess the compatibility of data from multiple sources.
Explain the effects of health information quality on an HIE.
Competency 5: Apply quality and change management concepts to health care information management.
Analyze statistical trends relevant to a selected condition.
Assess quality measures relevant to a selected condition.
Competency 6: Communicate in a manner that is scholarly, professional, respectful of the diversity, dignity, and integrity of others, and is consistent with the expectations for healthcare professionals.
Write clearly, with correct spelling, grammar, and syntax, and good organization.
Apply proper APA formatting and style to citations and references.