Applying the Supply and Demand Model
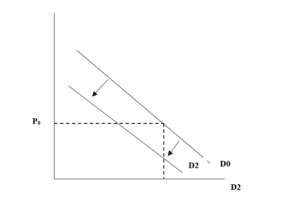
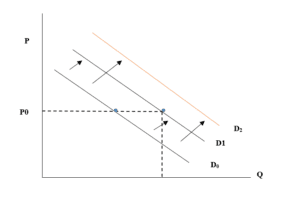
Effects of Consumer Tastes and Preferences on Products’ Demand Curve
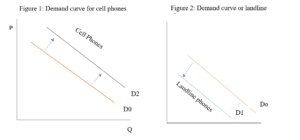
Ten to twenty years ago, landline phones were in high demand because there was no potential substitute. Consumers developed a subjective feeling about the desirability of a more advanced mode of communication (Browning & Zupan, 2015). Continuous innovation led to the creation of portable cell phones with advanced and efficient functionalities. Consumers then decided that cell phones were more appealing than landline phones. Therefore, consumers’ tastes and preferences for highly functional and flexible communication mediums heightened the demand for cell phones while decreasing the need for landline phones.
The Law of Demand
July is a national ice cream day; hence, ice cream cones have a higher price elasticity of demand than in December. Here, price elasticity of demand measures how sensitive the quantity of ice cream cones demanded is to a change in their prices (Labandeira, Labeaga & López-Otero). During National Ice Cream Month, ice cream cones are less sensitive to price hikes. In other words, the price does not affect the quantity of ice cream cones demanded in July, unlike in December.
Price Elasticity of Demand
Price elasticity is calculated as,
- Price Elasticity of Demand = % Change in Quantity Demanded / % Change in Price
- Sales of apples increased by 25% (50/200 * 100)
- Prices of apples decreased by 10% (0.1/1 * 100)
- Therefore, price elasticity = 0.1/0.25 = 0.4
This value shows that the price is elastic since consumers’ buying habits changed (increased) when the costs of apples increased.
Profit projections
£1 * 200 = £200
£0.9 * 250 = £225
The total revenue for Super-Save Supermarket will increase in the long run.
Cross Elasticity of Demand
If Super-Save Supermarket sold 150 pounds of bananas last week and 120 pounds this week, bananas and apples are substitutes. The scenario exhibits a positive cross-price elasticity, where the demand for bananas decreases as the apple price decreases (Beveridge, 2018). From an economic standpoint, the cross-elasticity of demand concept measures the responsiveness of the quantity of goods demanded due to the other in the price change.
- Cross-elasticity of demand = % change in the quantity of bananas demanded / % of the price of apples.
- Cross-elasticity demanded = 20%/10%
- Therefore, cross-elasticity demanded = 2
The Law of Supply
Farmer Brown will devote more of his acreage to planting soybeans than corn. An increase in price for soybeans implies that he will increase the production of soybeans to make more profits. The law of supply argues that price changes affect producer behavior – the producer will produce more type A products than B if the price of the earlier product increases (Browning & Zupan, 2015). A rise in prices encourages profit-seeking behavior. As a result, the farmer takes several actions, including investing more in soybeans, planting more soybeans, and increasing the acreage allotted for soybeans to increase their output.
Figure 3: The law of supply for soybeans
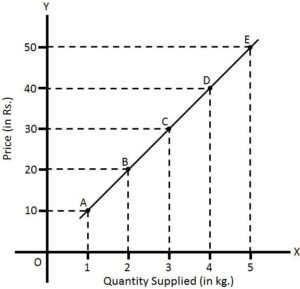
Figure 4: The law of supply for corns
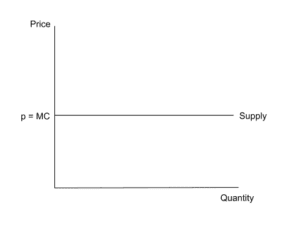
Figure 3 shows the direct and positive relationship between price and quantity supplied. The supply of a product is directly related to its cost; hence, the curve slopes upward towards the right, courtesy of the positive relationship (Bas, Mayer & Thoenig, 2017). On the other hand, Figure 4 demonstrates that the marginal cost is zero since the production cost exceeds the marginal cost. It means that Farmer Brown can produce a certain quantity of corn at a lower average cost than soybeans.
Supply and Demand Models
Figure 5: Demand and supply curve for hamburgers
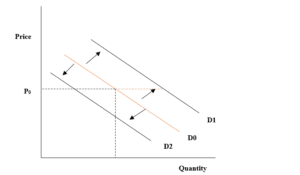
Suppose Amy’s Diner is D2 while Joe’s Burger Stop is D1. An increase in Amy’s hamburger meat leads to a decrease in demand. The equilibrium price at P0 shifts downwards for Amy’s hamburger. Customers will switch to Joe’s Burger Stop because of the shift in equilibrium price, which is lower than that of Joe’s. As a result, Amy’s sales (D0) will plummet while Joe’s will skyrocket (D1), as shown in Figure 5.
Figure 6: Equilibrium price and quantity of French fries Amy sold
French fries complement hamburgers, implying that a decline in demand for hamburgers will automatically reduce their sales. However, the equilibrium price for French fries will remain constant. Ideally, more customers who take hamburgers left the stop shop for its rival because of the price increase. This situation led to a decline in demand for French fries, as shown in Figure 6.
Figure 7: The equilibrium price and quantity of hamburgers Joe sold
The equilibrium price at Joe’s Stop Shop did not change. The constant price attracted more customers who could no longer afford hamburgers at Amy’s. This spike in demand resulted in more sales, shifting the demand curve upwards (Basu, 2019). D0 indicates the initiation demand for hamburgers at Joe’s Stope, while P0 is the initial equilibrium price. Therefore, the demand increased while the equilibrium price remained unchanged, as shown in Figure 7.
Similarly, D2 in Figure 7 indicates the shift in direction for soft drinks at Joe’s stop. Ideally, soft drinks are complementary to hamburgers. As a result, a rise in demand for hamburgers triggers a need for soft drinks, with the equilibrium price remaining constant.
The Supply Curve For Domestic Milk in the U.S
Figure 8: The supply curve for domestic milk in the U.S
Imposing tariffs on imported milk will raise their prices and reduce their demand. Meanwhile, the need for domestic milk will spiral, with the price remaining constant (Brecher, Chen & Choudhri, 2002). Eventually, the quantity of milk sold increases, raising the equilibrium price in the long run.
References
Bas, M., Mayer, T., & Thoenig, M. (2017). From Micro to Macro: Demand, Supply, and Heterogeneity in the Trade Elasticity. Journal of International Economics, 108, 1-19. https://doi.org/10.1016/j.jinteco.2017.05.001
Basu, C. (2019). What Happens to the Equilibrium Price When Quantity of Supply & Demand Shifts Upward? Small Business – Chron.com. Retrieved from https://smallbusiness.chron.com/happens-equilibrium-price-quantity-supply-demand-shifts-upward-36644.html.
Beveridge, T. (2018). A Primer on Microeconomics (2nd ed.). Business Experts Press.
Brecher, R., Chen, Z., & Choudhri, E. (2002). Absolute and Comparative Advantage, Reconsidered: The Pattern of International Trade with Optimal Saving. Review of International Economics, 10(4), 645-656. https://doi.org/10.1111/1467-9396.t01-1-00355
Browning, E., & Zupan, M. (2015). Microeconomics: Theory & Applications (12th ed.). John Wiley & Sons, Inc.
Labandeira, X., Labeaga, J., & López-Otero, X. (2017). A Meta-Analysis on the Price Elasticity of Energy Demand. Energy Policy, 102, 549-568. https://doi.org/10.1016/j.enpol.2017.01.002
ORDER A PLAGIARISM-FREE PAPER HERE
We’ll write everything from scratch
Question 
Over the past 10–20 years, landline phone use has fallen while cell phones and smartphones have increased. Explain how consumer tastes and preferences changes affect each product’s demand functions. Draw graphs for each of the two products (landlines and cell phones/smartphones) illustrating what has happened to the demand curve for each one. Your response should be at least 75 words (1 paragraph); include graphs to support your explanations.
Applying the Supply and Demand Model
Please explain why the law of demand is not violated when you observe that the quantity demanded of ice cream cones at your local park is lower in December than in July, even though the price is higher in July than in December. Your response should be at least 75 words (1 paragraph).
This week, Super-Save Supermarket lowered the price of apples from $1 to 90 cents per pound. The quantity of apples sold last week was 200 pounds. This week, the amount sold was 250 pounds. Calculate the price elasticity of demand. Is it elastic, inelastic, or unitary elastic? What happens to total revenue? Your response should be at least 75 words (1 paragraph).
Using the information in the previous question, assume that Super-Save Supermarket sold 150 pounds of bananas last week and this week, it sold 120 pounds. Are bananas and apples complements or substitutes? What is the cross elasticity of demand? Explain your answer. Your response should be at least 75 words (1 paragraph).
Farmer Brown plants both soybeans and corn. If the price of soybeans increases and the cost of corn remains the same, what do you expect to happen to the amount of acreage he devotes to planting each crop? How does your answer help to explain the law of supply? Does the supply curve of corn or soybeans shift? Use graphs to illustrate your answer. Your response should be at least 75–150 words (1–2 paragraphs) in length, including charts with explanations.
Amy’s Diner and Joe’s Burger Stop are in the same neighborhood. Both menus include hamburgers, french fries, and soft drinks. Assume Amy’s supplier raises the price of hamburger meat while Joe’s does not. Using the supply and demand model, graphically show and provide a written explanation for each of the following:
The equilibrium price and quantity of hamburgers Amy sold
The equilibrium price and amount of french fries Amy sold
The equilibrium price and amount of hamburgers Joe sold
The equilibrium price and amount of soft drinks Joe sold
Your response should be at least 150–225 words (2–3 paragraphs) in length, including graphs.
In the United States, price floors are commonly used to support farmers, such as for dairy products. Assume several U.S. trading partners impose tariffs on dairy products exported from the United States. The taxes are practical, red, reducing from the United States, pushing me and pushing the milk price below the price floor.
Using a supply and demand model, illustrate what happens to the U.S. domestic milk price, the quantity of milk sold in the United States, and any surplus or shortage of milk. Be sure to support your graph with a written explanation.