Analysis of Graduate Psychology Students’ Survey Data- Descriptive Statistics Data Visuals and Insights
Case I: For Psychology majors, younger students are healthier than older students.
Statistical Test Procedure Applied and Justification: Test of Significance.
The test of hypothesis is appropriate for the study since we can use it to establish whether the students’ health is significantly different. The test will particularly aim to test whether there is a significant difference in mean health for younger psychology students compared to older students at a 5% significance level. Younger students were taken from the sample who were 35 years old and below.
X1= 0.3667, n1=12, S12=0.2064
X2 = 0.4625, n2=12, S22= 0.2191
Since n1 and n2 >30, we use a Z-test
but,
= S p = √ = = 0.21275
= √0.21275= 0.4612
= = = -0.2347
State the result of the procedure- was there a significant finding?
The p-value obtained is -0.2347, which is less than the critical value of 1.64 (alpha at 5% significance).
Interpretation and Meaning of Results
The small p-value obtained indicates that we accept the null hypothesis, which is also the research hypothesis, and conclude that younger students are healthier than older students. This is also evident from the comparison of the average health values (X1 and X2) for mean health status.
Case II: There is no difference between men and women in aggression.
Statistical Test Procedure Applied and Justification
A two-sample t-test is appropriate for this case. This is because it tests whether there is a difference in an outcome variable across the two categorical groups. Also, the data assumes a normal distribution, and the subjects for the study were randomly selected. Furthermore, the T-test is also suitable for small samples (LaMorte, 2017). The variation between the two groups is also homogenous without any outliers, making a two-sample t-test an appropriate statistical test. From the data, value 1 was assigned to males and 2 for females. The significance level was 5%.
State the result of the procedure- was there a significant finding?
| Independent Samples Test | ||||||||||
| Levene’s Test for Equality of Variances | t-test for Equality of Means | |||||||||
| F | Sig. | T | df | Sig. (2-tailed) | Mean Difference | Std. Error Difference | 95% Confidence Interval of the Difference | |||
| Lower | Upper | |||||||||
| Aggression | Equal variances assumed | 1.918 | .168 | -3.865 | 187 | .000 | -1.478 | .382 | -2.232 | -.723 |
| Equal variances not assumed | -3.926 | 166.613 | .000 | -1.478 | .376 | -2.221 | -.735 | |||
Table 1: SPSS Output on Two-sample t-test for Men and Women on Aggression
From the SPSS analysis, the p-value obtained is less than 0.05. From the table, the significance when equal variances and unequal variances are assumed is 0.000, reported as p<0.001 since it is too small.
Interpretation and Meaning of Results
The obtained p-values are smaller than the set critical value (0.05), which implies that we accept the null hypothesis that there is no significant difference between men and women based on aggression. However, the F-value for the differences in variance is not significant, which implies that the variances for the men and women groups do not vary.
Case III: 3: Is there a relationship between personality and life satisfaction?
Statistical Test Procedure Applied and Justification
The statistical test procedure applied for the test is Pearson Correlation to determine whether there is a relationship between personality and life satisfaction. Pearson’s correlation is the test statistic that is used as the basis for making the decision about the association between the two variables. The method is regarded as a reliable method of measuring the association between variables since it is based on the covariance method (Field, 2018). It gives information about the magnitude of the correlation as well as the direction of the relationship. The significance level is 5%. Agreeableness, Extraversion, and Conscientiousness are the personality traits studied.
State the result of the procedure- was there a significant finding?
| Correlations | |||||
| Satisfaction | Agreeableness | Extraversion | Conscientiousness | ||
| Satisfaction | Pearson Correlation | 1 | -.153* | -.036 | .035 |
| Sig. (2-tailed) | .036 | .624 | .633 | ||
| N | 189 | 189 | 189 | 189 | |
| Agreeableness | Pearson Correlation | -.153* | 1 | .158* | .055 |
| Sig. (2-tailed) | .036 | .030 | .456 | ||
| N | 189 | 189 | 189 | 189 | |
| Extraversion | Pearson Correlation | -.036 | .158* | 1 | -.015 |
| Sig. (2-tailed) | .624 | .030 | .840 | ||
| N | 189 | 189 | 189 | 189 | |
| Conscientiousness | Pearson Correlation | .035 | .055 | -.015 | 1 |
| Sig. (2-tailed) | .633 | .456 | .840 | ||
| N | 189 | 189 | 189 | 189 | |
| *. Correlation is significant at the 0.05 level (2-tailed). | |||||
Table 2: Pearson Correlation Output
The Pearson correlation value obtained for life satisfaction is -0.153, -0.036 for the extraversion trait, and 0.035 for Conscientiousness. The significance value for the correlation obtained is 0.036 for agreeableness, 0.624 for extraversion, and 0.633 for Conscientiousness.
Interpretation and Meaning of Results
Technically, the obtained correlation value indicates that agreeableness and extraversion personality traits are negatively correlated to life satisfaction. This implies that the increase in life satisfaction does not necessarily lead to increased agreeableness and extraversion personality traits. On the other hand, Conscientiousness is positively correlated to life satisfaction, correlation value=0.633. However, the significance values show that correlation values for extraversion (0.624), and Conscientiousness (0.633) are not significant since they exceed 0.05.
Section II: Data Visualization from the Obtained Findings
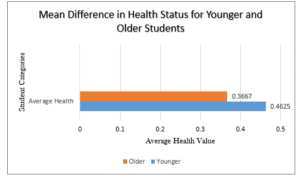
Figure 1: Mean Health Differences Between Younger and Older Students
In Figure 1 above, the mean health status of the students was assessed. Assuming that the health status values tend to be 1, with 1 being the healthiest person, the mean values for both groups indicate that younger students are younger compared to elderly students. The decision rule was based on the upper-tail approach, which requires that we reject the hypothesis if the obtained p-value, which is the test statistic is larger than the critical value. Therefore, the conclusion is that younger psychology students are healthier compared to older students.
References
Field, A. (2018). Discovering Statistics Using IBM SPSS Statistics. (4th Edition) California: SAGE Publications.
Kent University. (2021). SPSS Tutorials: Independent Samples T Test Retrieved from https://libguides.library.kent.edu/spss/independentttest
LaMorte, W. (2017). Hypothesis Testing: Upper-, Lower, and Two-Tailed Tests. Retrieved from https://sphweb.bumc.bu.edu/otlt/mph-modules/bs/bs704_hypothesistest-means-proportions/bs704_hypothesistest-means-proportions3.html
Miller, M. (2020). Statistical Thinking: Understanding correlation Retrieved from https://towardsdatascience.com/statistical-thinking-understanding-correlation-
ORDER A PLAGIARISM-FREE PAPER HERE
We’ll write everything from scratch
Question 
Week 8 Assignment: Results
For this assignment, you will be analyzing data and drawing meaningful conclusions. This assignment parallels the results section of a journal article.
Using the provided data set, you will generate descriptive statistics, data visuals, and a summary of your analysis. The data for this assignment is simulated data from a hypothetical web-based survey design. Subjects in this study were graduate psychology students. Subjects’ email addresses were randomly selected from a random sample of universities in the United States.

Analysis of Graduate Psychology Students’ Survey Data- Descriptive Statistics Data Visuals and Insights
Remember, this is a data set for which you were not one of the primary researchers.
Enlightened uses descriptive and inferential statistics to test the following hypotheses and research question:
For U.S. psychology majors, younger students are healthier than older students.
There is no difference between men and women in aggression.
Is there a relationship between personality and life satisfaction?
For each of the above:
Identify the type of statistical procedures used to test the hypothesis and why you selected this procedure
For example, A Pearson correlation was conducted to determine the relationship between height and weight.
State the result of the procedure- was there a significant finding?
For example There is a significant positive correlation between height and weight (r =.91, p <.05).
Provide an interpretation of the result and clearly explain what these findings mean (350-400 words)
For example, For this sample, the taller someone is, the heavier he or she will be
Next, choose one of your findings and create a data visual (e.g., graph) to accompany your results.
Use Sheet 2 from the Excel spreadsheet for this part.
If you are running an actual analysis (using SPSS, for example), then use Sheet 1.
Your graph should depict the result you have chosen. Ensure that your graph contains the following:
A title
Labels on each axis
A legend or labels on the data points
A brief explanation that tells the reader how to look at the graph and interpret your findings
Figure 1. Example: Height and Weight
As seen in Figure 1, as height increases along the x-axis, weight also increases on the y-axis. For example, individuals with a height of 5’1 weigh 90 lbs on average, whereas individuals who are 6 feet weigh approximately 189 lbs.