AC 499 Unit 9 Assignment Final Project Rainbow Paint Company – 2013 and 2012
Table of Contents
Graph 1: Comparative income statement 3
Graph 2: Comparative Retained Earnings Statement. 4
Graph 3: Comparative balance sheet 5
Letter to shareholders of Rainbow Paints Co. 12
Management Discussion and Analysis. 13
Financial highlight
This section has been done to help users of this report better understand how Rainbow Paint Company has been performing in the financial year ending on December 31st, 2013. It will explain the financial analysis done on the company’s financial statements.
Graph 1
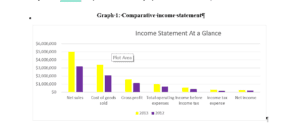
Graph 1: Comparative income statement
The company’s sales increased tremendously from $3,257,600 in 2012 to $5,125,000 in 2013. This has been a result of increased efforts in sales and more resources put into advertising. Sales returns and allowances also increased within the same periods to bring the total net sales to $5 million in 2013. This represents a $1.8 million increase in net sales in 2013. Despite the fact that the increased number of units sold, the company was able to reign in its cost of goods to stand at 3.4 million in 2013. Compared with the sharp increase in the number of units sold, this was commendable on the side of the company. This led to the company realizing an increase in gross profits from $1.12 million in 2012 to $1.6 in 2013. Total operating expenses also rose to $975,000 in 2013 compared to $688,000 in 2012. This can be attributed to the larger number of units sold in 2013 compared to 2012. From the graph below, you can see net sales, gross profits, income before tax and net income were all higher in 2013 than in the previous year.
Graph 2
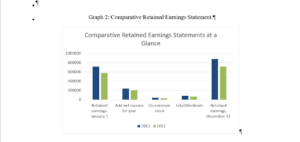
Graph 2: Comparative Retained Earnings Statement.
A quick look at Comparative retained earnings stamen for the two years shows a good trend. At the beginning of 2013, the company had retained earnings of $ 723,000. After operations, it was able to add a net income of $245,000 within the year to bring the total to $968,000. This is a big improvement from the $793,000 realized in 2013 before dividends were paid. This year, the company could pay $40,000 in dividends to its preferred stocks. We also paid $45,000 in total dividends to common stocks. This represents an increase of $15,000. After paying this were able to close the year with $883,000 in retained earnings. This is a vote of confidence in our efforts to increase efficiency this year, as we were able to pay dividends and still retain earnings for future operations.
Graph 3
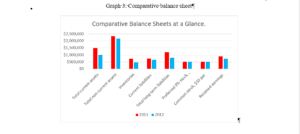
Graph 3: Comparative balance sheet
A sneak peek of the company’s comparative balance sheet shows good improvement in 2013. By the close of the year, the company’s total current assets increased by $500,000 to $1,500,000; Total non-current assets also increased from $2,173,000 in 2012 to 2,343,000 in 2013. The company increased its inventory from $480,000 in 2012 to $720,000 in 2013; this means it can generate increased sales and acquire new assets. Current liabilities increased by $100,000 from 2012 to close the year at $750,000. Long-term liabilities also increase to $1.21 million from $800,000 the previous year. The preferred and common stock remained constant at $500,000 each in both years. The company was, however, able to increase its retained earnings to $883,00 from $723000. All this shows that the company’s balance sheet is improving with time.
Ratio analysis
| Ratio | Solution | ||
| 1 | Working capital | $750,000.00 | |
| 2 | Current ratio | 2 | |
| 3 | Quick ratio | 1 | |
| 4 | Accounts receivable turnover | 13.33 | Times |
| 5 | Number of days’ sales in receivables | 27.38 | Days |
| 6 | Inventory turnover | 5.67 | |
| 7 | Number of days’ sales in inventory | 64.41 | Days |
| 8 | Ratio of fixed assets to long-term liabilities | 1.73 | |
| 9 | Ratio of liabilities to stockholders’ equity | 1.04 | |
| 10 | Number of times interest charges earned | 6.19 | Times |
| 11 | Number of times preferred dividends earned | 6.13 | Times |
| 12 | Ratio of net sales to assets | 1.43 | |
| 13 | Rate earned on total assets | 6.98% | |
| 14 | Rate earned on stockholders’ equity | 13.59% | |
| 15 | Rate earned on common stockholders’ equity | 3.93% | |
| 16 | Earnings per share on common stock | $4.10 | |
| 17 | Price-earnings ratio | 6.1 | |
| 18 | Dividends per share of common stock | $0.90 | |
| 19 | Dividend yield | 3.60% |
The company closed the year with working capital of $750,000. This means we are able to meet our obligation and still be left with enough resources to run our operations. The current ratio for the whole year stood at 2. This means our liquidity is solid, and we are able to settle our current liabilities using our current assets comfortably. Further analysis shows the company had a quick ratio of 1. This is also good because the company has enough cash reserves to settle its current liabilities without relying on inventory and other assets. The ratio of fixed assets to long-term liabilities stood at 1.73. this means most of the company’s assets are financed using a long-term loan. We will maintain this number at that level to benefit both on leverage and still mitigate risk. The number of times interest charges earned ratio was 6.13 times. This means the company does not present a risk to both investors and creditors as it can comfortably cover its interest charges hence not susceptible to bankruptcy or default.
In terms of efficiency, the company’s inventory turnover stood at 5.67 in 2013. This means the company has a strong sales volume, and it is moving its inventory at healthy speeds. The number of days’ sales inventory was 64.41 meaning the company’s funds are tied in inventory for that long. Measures should be taken to reduce this number to at least 30-45 days in 2014. Asset turnover was 1.43 in 2013. This gives a vote of confidence on the company’s ability to generate profits using its assets. With a Rate earned on total assets standing at 6.98%, the company is making sufficient earnings before interest and taxes are deducted relative to its net assets. This means the company is effectively using its assets to generate revenue before meeting its contractual obligations
Looking at profitability, the company is also doing well. In 2013, the rate earned on stockholders’ equity stood at 13.59%, while the rate earned on common stockholders’ equity was 3.93%. This means the company is utilizing capital injected into the company by investors well to generate profits. The company is generally making 13.59 cents for every dollar invested, and 3.93 cents for common stock invested. Earnings per share on common stock was $4.10 in 2013. This means the company is generating enough profits to enable it to pay a handsome dividend to common shareholders. We should reinvest some of this money back into the company so as to reduce the number of assets financed by debt and also increase profits in the coming years. The company’s Price-earnings ratio stood at 6.1 in 2013. Even though this number is low, it means the company is greatly undervalued in the market. This presents a good chance for investors to buy stocks now to maximize future profits when the share prices rise. The company expects to pay a dividend of $0.90 per share of common stock. The dividend yield was 3.6%; this shows the return an investor would expect if they were to buy the stock at the current market value.
Financial Analysis
Comparative financial statements for Rainbow Paint Company for the years ended December 2012 and 2013
| Rainbow Paint Co. Comparative Income Statement for the Years Ended December 31st, 2013, and 2012 | |||||
| Rainbow Paint Co.’s comparative financial statements for the years ending December 31st, 2013, and 2012 are as follows. The market price of Rainbow Paint Co.’s common stock was $30 on December 31st, 1999, and $25 on December 31st, 2013. | |||||
| 2013 | 2012 | ||||
| Sales | $5,125,000 | $3,257,600 | |||
| Sales returns and allowances | 125,000 | 57,600 | |||
| Net sales | $5,000,000 | $3,200,000 | |||
| Cost of goods sold | 3,400,000 | 2,080,000 | |||
| Gross profit | $1,600,000 | $1,120,000 | |||
| Selling expenses | $650,000 | $464,000 | |||
| Administrative expenses | 325,000 | 224,000 | |||
| Total operating expenses | $975,000 | $688,000 | |||
| Income from operations | $625,000 | $432,000 | |||
| Other income | 25,000 | 19,200 | |||
| $650,000 | $451,200 | ||||
| Other expenses (interest) | 105,000 | 64,000 | |||
| Income before income tax | $545,000 | $387,200 | |||
| Income tax expense | 300,000 | 176,000 | |||
| Net income | $245,000 | $211,200 | |||
| Rainbow Paint Co. Comparative Retained Earnings Statement for the Years Ended December 31st, 2013 and 2012 | |||||
| 2013 | 2012 | ||||
| Retained earnings, January 1st | $723,000 | $581,800 | |||
| Add net income for year | 245,000 | 211,200 | |||
| Total | $968,000 | $793,000 | |||
| Deduct dividends: | |||||
| On preferred stock | $40,000 | $40,000 | |||
| On common stock | 45,000 | 30,000 | |||
| Total | $85,000 | $70,000 | |||
| Retained earnings, December 31st | $883,000 | $723,000 | |||
| Rainbow Paint Co. Comparative Balance Sheet December 31st, 2013 and 2012 | |||||
| Assets | 2013 | 2012 | |||
| Current assets: | |||||
| Cash | $175,000 | $125,000 | |||
| Marketable securities | 150,000 | 50,000 | |||
| Accounts receivable (net) | 425,000 | 325,000 | |||
| Inventories | 720,000 | 480,000 | |||
| Prepaid expenses | 30,000 | 20,000 | |||
| Total current assets | $1,500,000 | $1,000,000 | |||
| Long-term investments | 250,000 | 225,000 | |||
| Property, plant, and equipment (net) | 2,093,000 | 1,948,000 | |||
| Total assets | $3,843,000 | $3,173,000 | |||
| Liabilities | |||||
| Current liabilities | $750,000 | $650,000 | |||
| Long-term liabilities: | |||||
| Mortgage note payable, 10%, due 2009 | $410,000 | – | |||
| Bonds payable, 8%, due 2012 | 800,000 | $800,000 | |||
| Total long-term liabilities | $1,210,000 | $800,000 | |||
| Total liabilities | $1,960,000 | $1,450,000 | |||
| Stockholders’ Equity | |||||
| Preferred 8% stock, $100 par | $500,000 | $500,000 | |||
| Common stock, $10 par | 500,000 | 500,000 | |||
| Retained earnings | 883,000 | 723,000 | |||
| Total stockholders’ equity | $1,883,000 | $1,723,000 | |||
| Total liabilities and stockholders’ equity | $3,843,000 | $3,173,000 | |||
| Shares of Common Stock | 50000 | 50000 | |||
Letter to shareholders of Rainbow Paints Co.
I hope this finds you in good health. This year our company has been busy. It has reorganized several aspects of the business to ensure we remain profitable both in the short and long run.
In a bid to generate more sales, we have employed new staff to enable us to reach more customers and generate more sales. Even though this has increased our staffing expense, it has also helped generate more sales, as evident from the income statement. We have also embarked on an aggressive marketing campaign across different platforms. Using traditional media, that is, television and radio, we have more marketing campaigns going on. We have also ventured into social media advertising. This has been largely because most of our potential customers, especially the younger generation, are more into these platforms. Even though this has brought in more expenses, it has also increased sales from $3,256,000 in 2013 to $5,125,000 this year. As the company CEO, I have appointed a new marketing head to coordinate these new efforts.
In our effort to motivate our employees, we have introduced a new method of remuneration. From now henceforth, the company will be paying employees part fixed and part variable wage. This means employees with more output will take home more. We have purchased more sales vehicles to ensure employees are well-facilitated in the market.in an effort to reign in on our financing using debt, we have also decided to retain a chunk of the $883,000 earnings realized this year. This would enable us to finance our operation better. We will be paying a dividend of $0.93 per share of common stock.
In order to increase revenue, we have also decided to increase our research and development budget. This will help us develop better products that can compete competitively in the market. This will ensure the company remains profitable in the future. We will be rolling out the first batch of our new assorted paints in the first quarter of 2014.
Come 2014; we will be adopting lean six sigma in our production lines. This is an effort to minimize costs as we strive to be more efficient and effective in how we remove production. This will help reduce waste and variation in our production lines.
As we close the year, we have learned a lot from our past, we know our strengths, weaknesses, opportunities at our disposal, and the threats which face the company. We are ready for a better 2014. See you at the annual general meeting.
Management Discussion and Analysis.
This part is meant to provide investors both current and prospective with additional information that is not necessarily in the financial statement to help them make better decisions. As of December 31st 2013, the company is financially healthy. It can meet its short- and long-term obligations without compromising on liquidity; therefore, it is safe to invest in. The company provides assorted paints to consumers. With the current young generation growing at a good rate, the company is poised to have healthy growth rates. As this generation buys houses in the near future, paints will be in high demand.
With the company adopting a new production methodology, lean six sigma, the company will be in a position to reduce its historical costs while still producing quality products. The company is also using alternative methods of marketing. Using social media will enable the company to reach more people in the future at a lower marketing cost than ever before. This will increase our profit margins and put more money into investors’ pockets. With today’s technological advances, the company is also able to access more markets both locally and internationally. Using e-commerce, the company can now source customers from other countries at low transaction rates.
Now is the time for any investor to invest in the company as it seeks to expand. This will guarantee you good returns in the future. With a good management team and dedicated employees, the company is poised to scale to higher heights in the near future.
References
Annual Reports. (n.d.). Retrieved from Sherwin Williams: https://investors.sherwin-williams.com/annual-reports/
Buffett, W. E. (2018, February 24th). Berkshire’s Performance vs. the S&P 500. Retrieved from http://www.berkshirehathaway.com/letters/2017ltr.pdf: http://http://www.berkshirehathaway.com/letters/2017ltr.pdf/letters/2017ltr.pdf
Management’s Discussion and Analysis-Guidance on Preparation and Disclosure. (n.d.). Retrieved from Chartered Professionals Canada: https://www.cpacanada.ca
ORDER A PLAGIARISM-FREE PAPER HERE
We’ll write everything from scratch
Question 
AC 499 Unit 9 Assignment Final Project Rainbow Paint Company – 2013 and 2012
Description
AC 499 Unit 9 Assignment Final Project Rainbow Paint Company
Instructions Summary:
Step 1: Practice
Complete the AC499 Financial Report Analysis – Rainbow Paint Co. as practice for the Unit 4 assignment. The solutions for the review problem can be found here.
Step 2: Review Ratio Sheet
Review the AC499 Financial Report Analysis Unit 4 Ratio Sheet.
Step 3: Financial Analysis
Complete a financial analysis of the company financials for Quixote Consulting. Use the Excel Template titled: “Unit 4 Financial Report Analysis Template.” Be sure to review the Excel tab titled “Hints & Instructions” before you attempt the assignment tab.
Review complete Unit 4 assignment details and rubrics.